
Vitality in America 2023
The second annual Vitality in America study, commissioned by The Cigna Group, explores the state of vitality in the United States along with health attitudes, behaviors, social determinants of health, and experiences in health care and work – as well as how people’s perceptions of these topics have changed and evolved since 2022. The research is based on a survey of 10,000 adults that was fielded in June 2023 by Morning Consult. It utilizes the Evernorth Vitality Index (EVI)– a subjective measure of health and wellbeing – to understand the capacity of Americans to pursue life with health,strength, and energy.
Vitality is composed of eight interdependent, dynamic dimensions of health and well-being: emotional, environmental, financial, intellectual, occupational, physical, social, and spiritual. A person’s perceived ability to make choices and engage willingly, develop skills and capacities, and connect to others across these life domainsimpacts their vitality.
In this year’s survey, we found that while the state of vitality in the United States hasn’t changed much year over year, individuals across all age groups, sexes, and races are struggling with physical and mental health and are stressed about financial health. The study confirms the inextricable link between vitality, emotional health, stress, and the ability to perform day-to-day tasks. It examines the vitality of the working population and finds that workers with high vitality are healthier, perform better on the job, work harder, and better utilize their health benefits, making a case for employers to develop strategies to retain high vitality workers.
What’s different in this year’s report is our deep dive into Generation Z adults – the cohort most notable for lower vitality levels in 2022. In addition to the main vitality survey fielded among a general population sample of 10,000 adults, an additional survey was fielded among 4,000 adults, one-quarter of those who were Gen Z adults (those born between 1997 and 2005). We found that Gen Z’s mental health challenges play a considerable role in their lower vitality. So does their financial insecurity, as money is top of mind for Gen Z. We also found that Gen Z still struggles with loneliness. Many are underwhelmed by their experience in the workplace and feel burned out. Interestingly, Gen Z reports more negative consequences resulting from social media use than non–Gen Z generations.
Let’s take a closer look at this year’s research, which gives insight into how individuals can improve their health, well-being, and vitality, as well as how employers can help their workforces do the same.
Keep scrolling for the full report, or download it as a PDF
Prefer to read this content in PDF format? We've got you covered. Click to download below, or keep scrolling to view the full findings.
Table of contents
- Americans struggle most with physical, emotional, and financial dimensions of health
- The state of vitality among the working population
- Life stage, social needs, ethnicity, age, gender, sexual orientation, and relationship status all impact vitality
- Key takeaways on vitality and the general population
Americans struggle most with physical, emotional, and financial dimensions of health
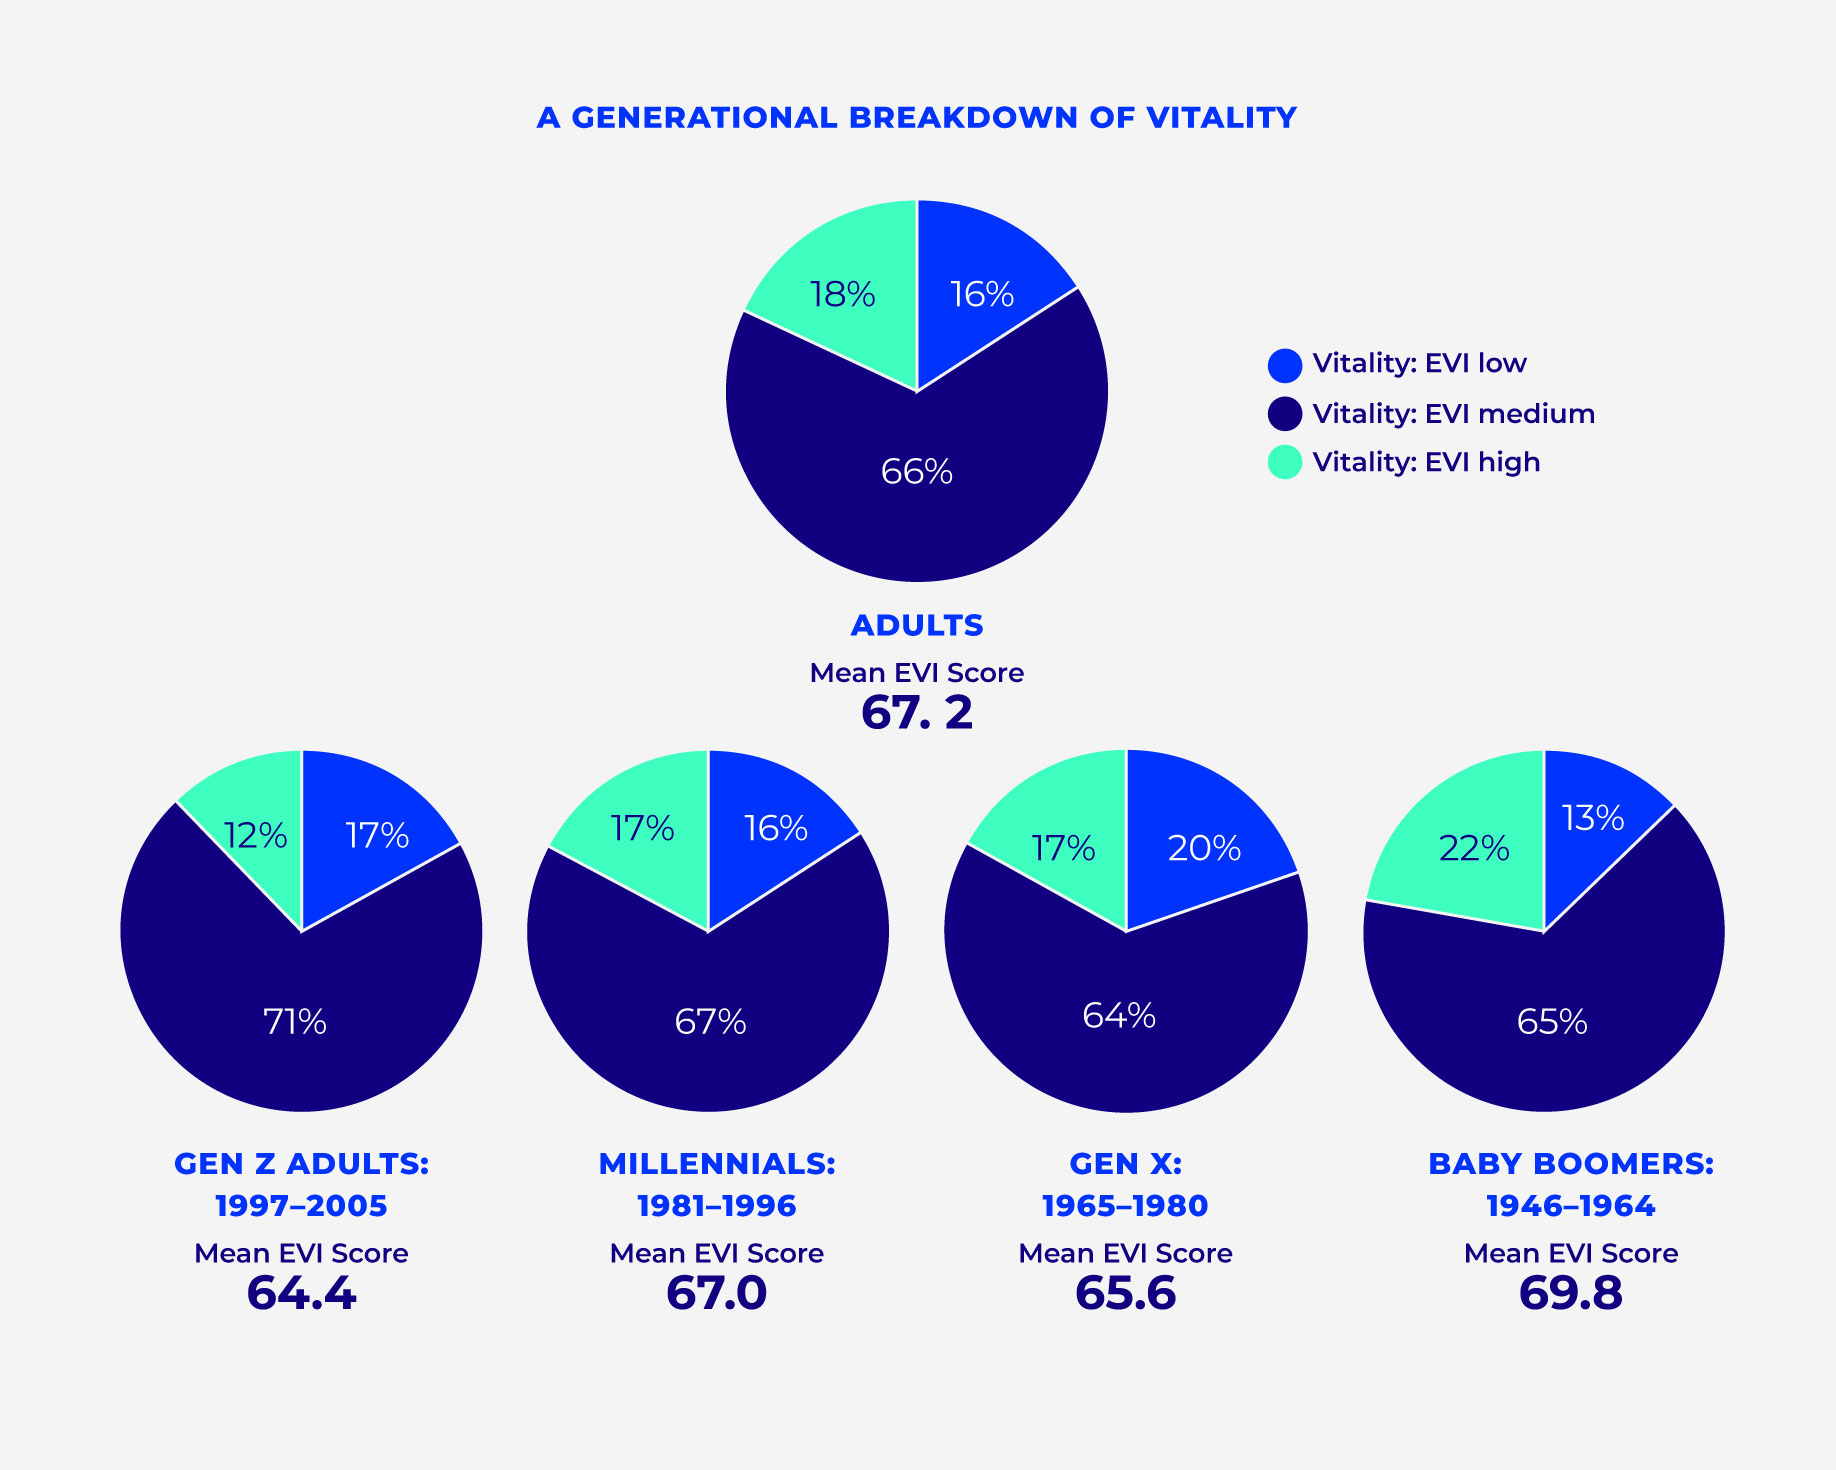
Since our last study was released in November 2022, the vitality of adults in the United States has stayed relatively flat. U.S. adults report a 67.2 out of 100 average vitality score, which is stable from 2022, when the average was 67.4.
However, digging deeper into the various dimensions of health uncovers some interesting changes from last year, particularly in the physical, emotional, and financial dimensions of health and well-being, where we see downward shifts.
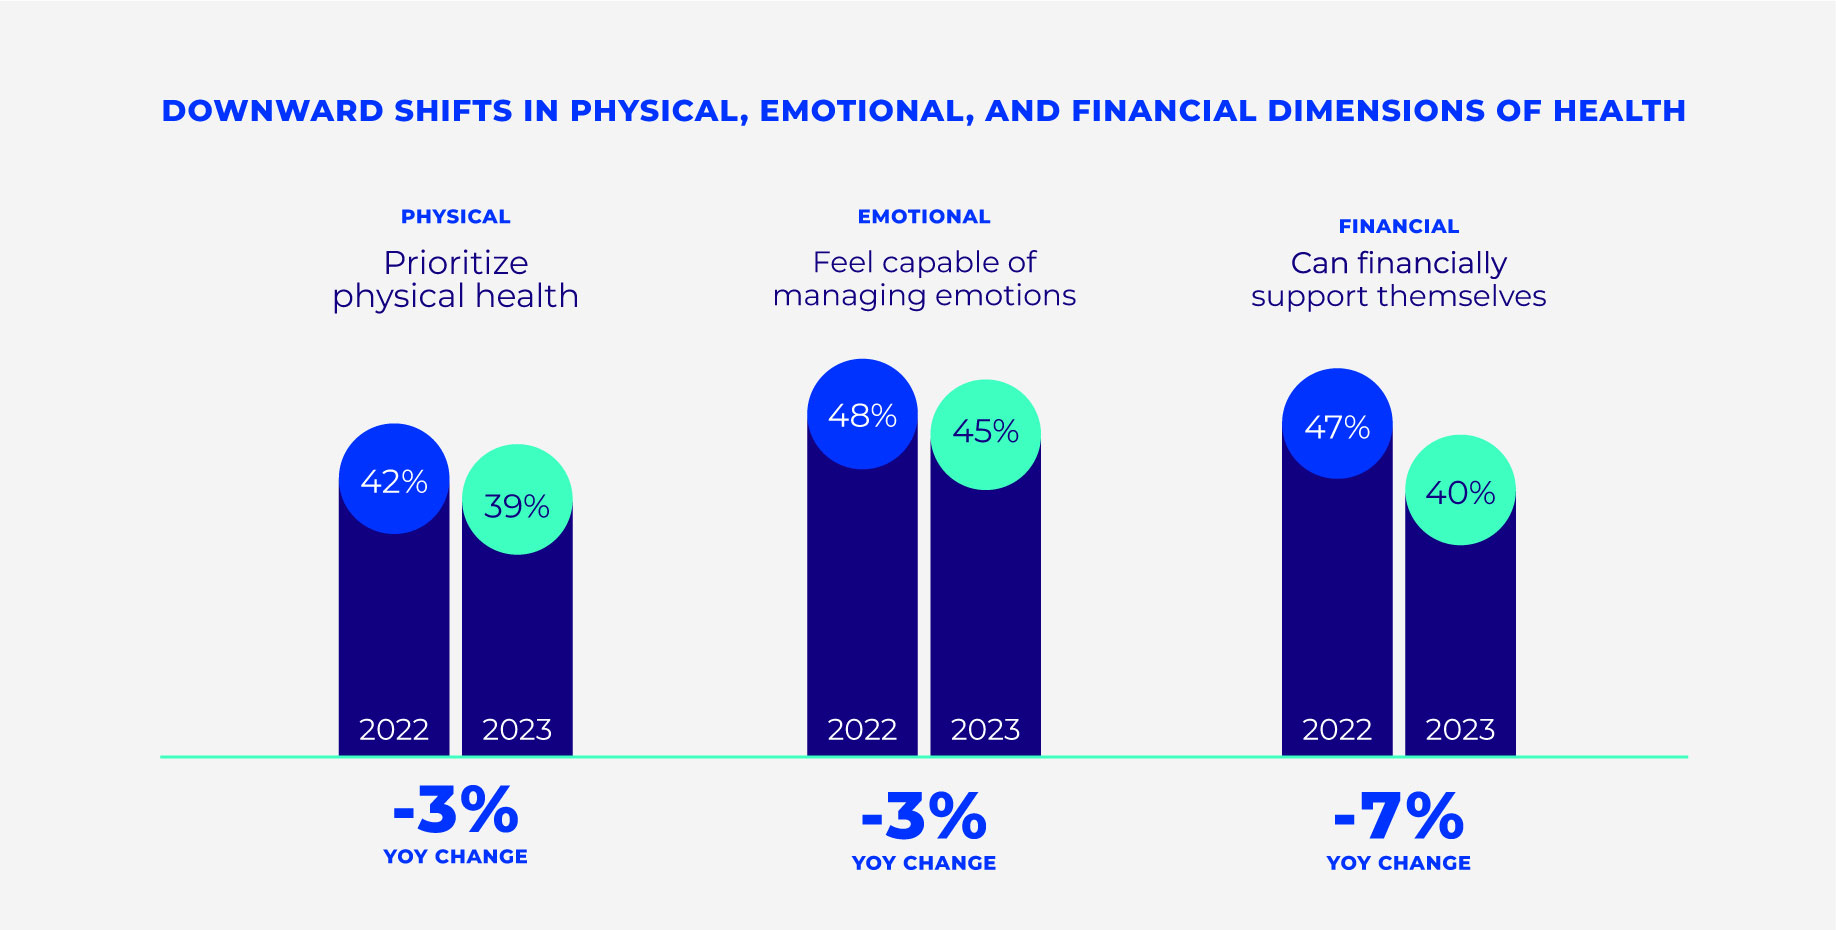
Even though U.S. adults are struggling across the physical, emotional, and financial dimensions of health and well-being, there is an increase in optimism from last year: 47% report looking forward to each new day (up from 43% last year), and 41% report feeling alive and vital (compared with 39% last year).
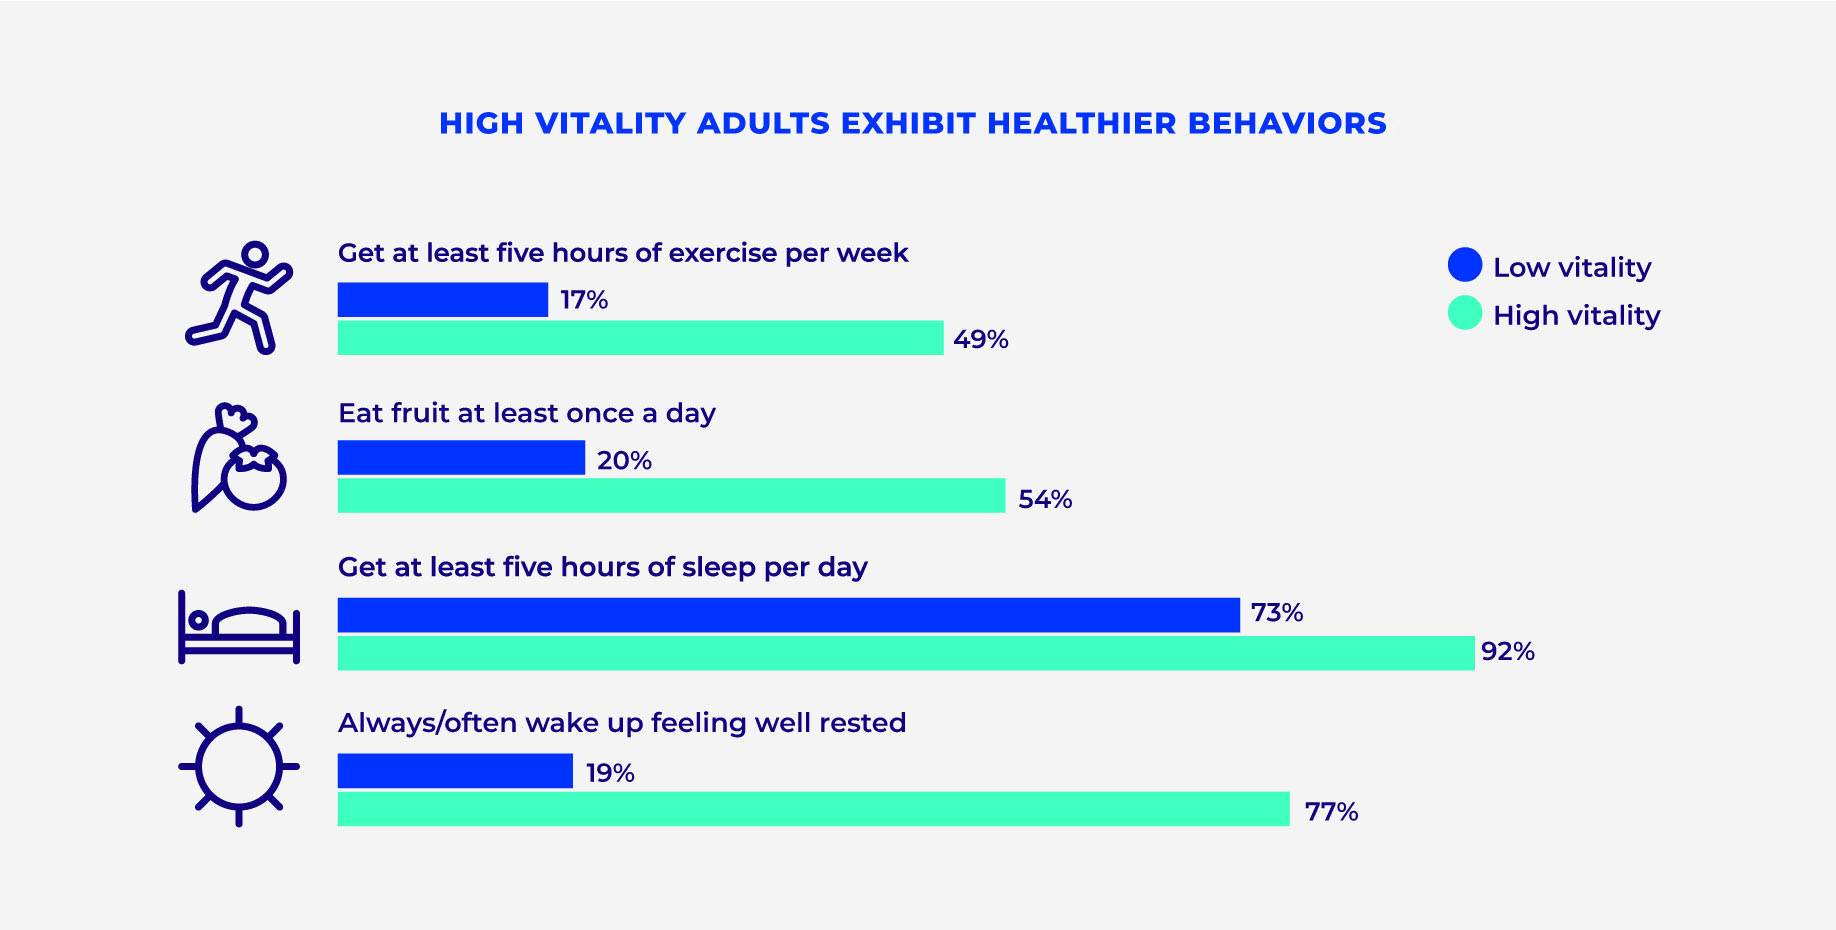
High vitality among U.S. adults in 2023 is associated with better physical health, driven by healthier habits and higher health engagement. As we found last year, adults with high vitality are more likely to report excellent or very good overall physical health than those with low vitality. They tend to have healthier habits too, with high vitality adults more likely to get five or more hours of exercise per week than low vitality adults. High vitality adults are also more likely to eat fruit at least once a day, get five or more hours of sleep, and report feeling well rested. This engagement and investment in their health pays off, with nearly 2 in 5 high vitality adults reporting not having chronic conditions, while fewer than 1 in 5 low vitality adults can say the same.
Overall, the research points to general declines in self-reported health, with perception of physical health down six points from last year. Our research finds that low vitality is associated with lower feelings of control over future health. Access to care is a bigger issue this year than last year, with more U.S adults reporting that cost and transportation issues prevented them from getting care this year.
- 23% said cost was the reason they didn’t get care in 2023 (vs. 19% in 2022)
- 22% said they didn’t get a prescribed medication due to cost (vs. 19% in 2022)
- 21% said they didn’t get care because of transportation challenges (vs. 19% in 2022)
New to this year’s report is a drilldown into chronic conditions among U.S. adults. Overall, we see that having good management of chronic conditions has a positive impact on vitality. We are also able to dive specifically into how living with a chronic condition, such as cancer or depression/anxiety, impacts vitality.
Key among the findings was that high vitality adults diagnosed with cancer or depression/anxiety are significantly more satisfied with their life than their low vitality counterparts. What’s interesting is that their outlook on life seems highly correlated to vitality. In fact, most adults with cancer or depression/anxiety who have high vitality feel their life is worthwhile, feel their life is close to their ideal, and are generally happy in their life.
High vitality adults living with cancer rate their overall and physical health higher than adults with low vitality who have cancer. They rate their mental health more positively and are less likely to also be diagnosed with depression/anxiety or report symptoms of depression. The majority (85%) of high vitality adults living with cancer rate their mental health as excellent or very good, which is significantly more than the 21% of low vitality adults living with cancer who say the same.
What’s more, high vitality adults with cancer or depression/anxiety are more likely to want to learn how to improve their vitality (61% vs. 32% with depression, 41% vs. 23% with cancer), and they engage in healthy behaviors that can help them do so. They are more likely to get regular exercise, spend time outdoors, eat fruit daily, and get enough sleep.
High vitality adults with cancer or depression/anxiety also have much higher resilience than their low vitality counterparts, likely because they report having a better support system, feeling more confident they can manage their health condition, and feeling more in control of their future health than those with low vitality.
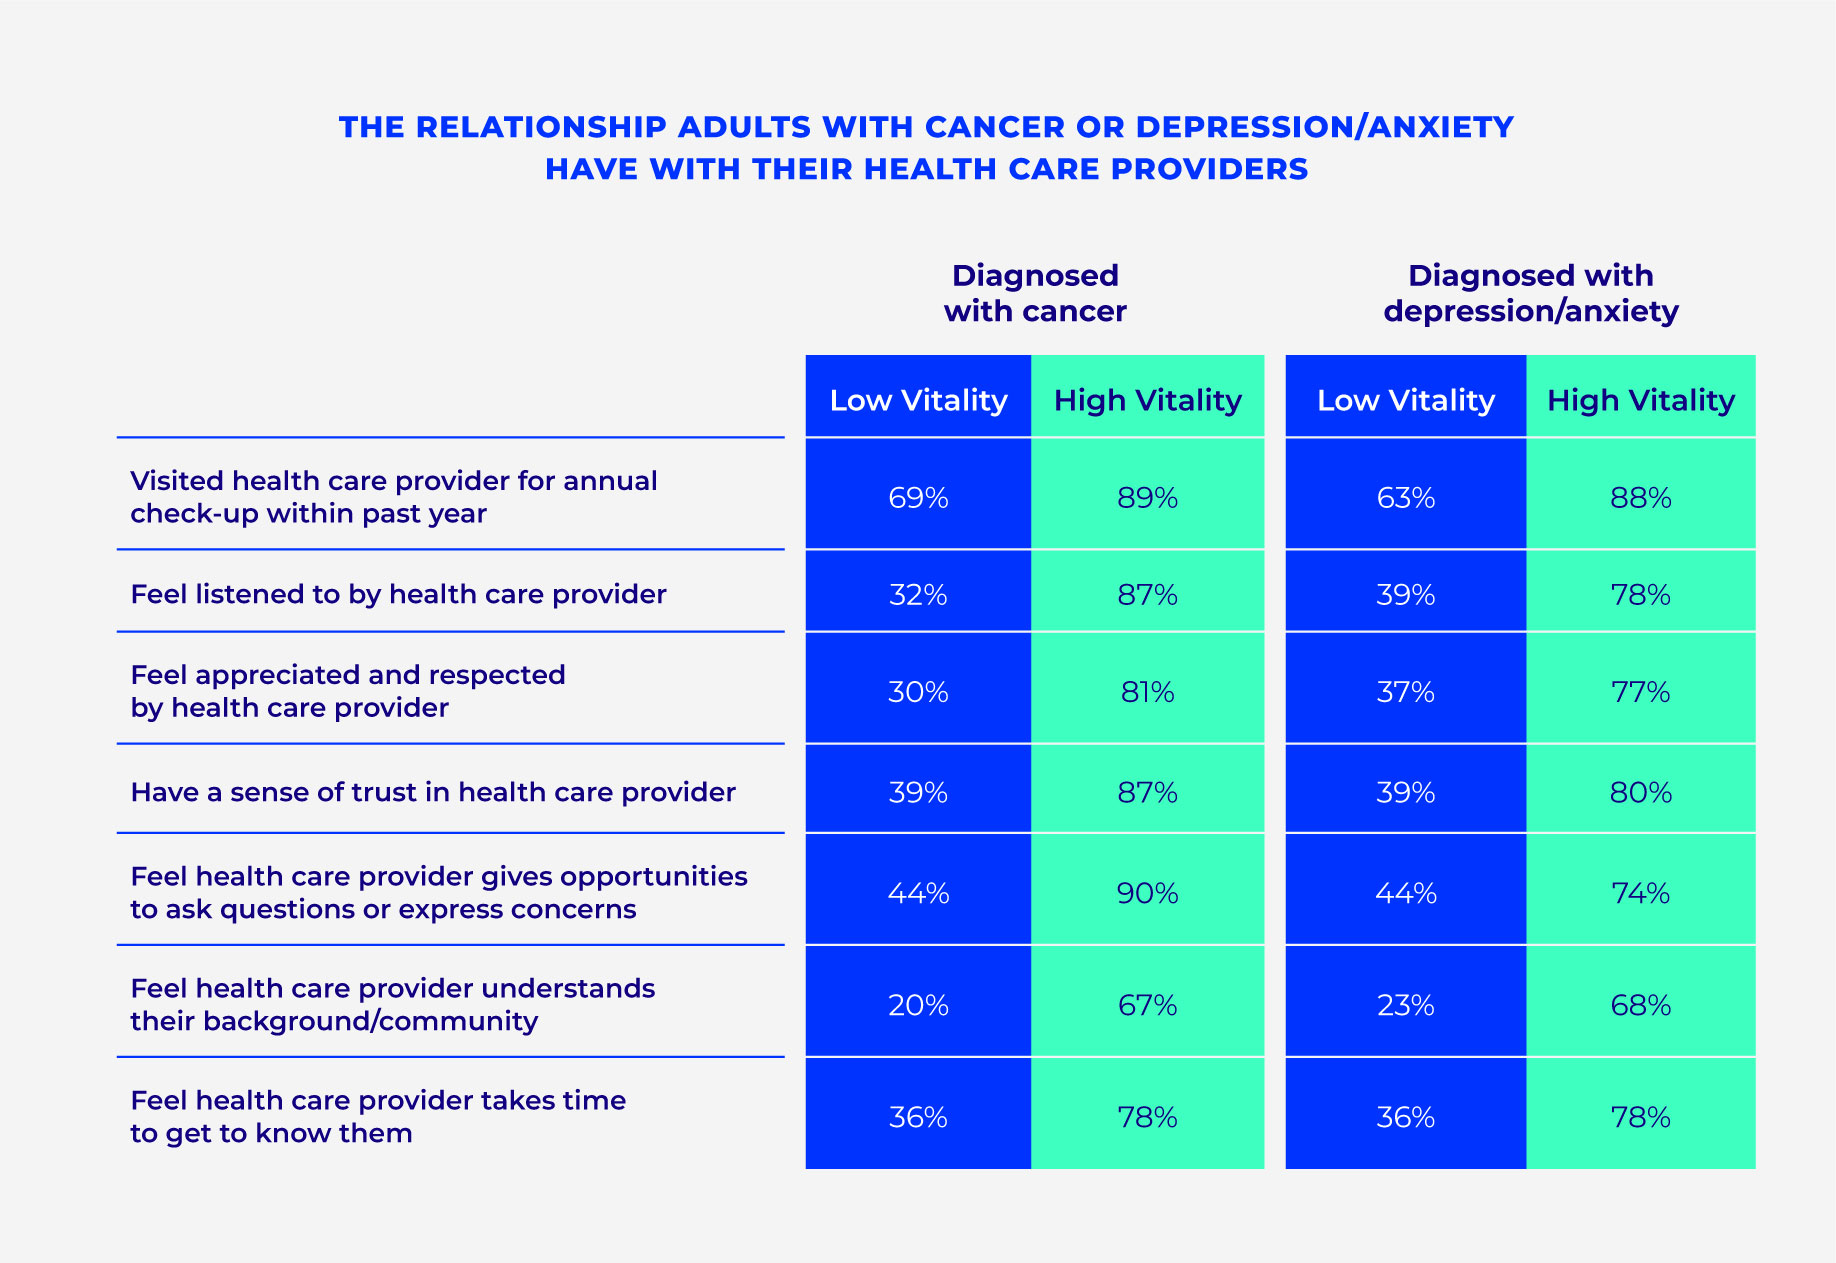
Importantly, high vitality adults with cancer or depression/anxiety have better relationships with their health care providers and are more likely to have visited a provider for a check-up in the past year than low vitality adults with cancer or depression/anxiety. High vitality adults with depression/anxiety are significantly more likely to have seen a mental health professional in the past year (61% vs. 44% of low vitality), indicating people are addressing their mental health conditions. Most high vitality adults who did not visit a mental health professional felt they didn’t need to, while those with low vitality were more likely to have experienced a barrier to getting care.
Mental health and emotional well-being are also significant drivers of vitality. Adults with strong mental health are 10 times more likely to have high vitality than those with fair or poor mental health. Adults with low vitality who report struggling with their mental health are more likely to experience a lack of motivation and enthusiasm. They also report feeling like they don’t have anything to look forward to and often find themselves getting agitated.
Adults are most stressed about their finances, followed by their housing conditions, work, family or social relationships, and health.
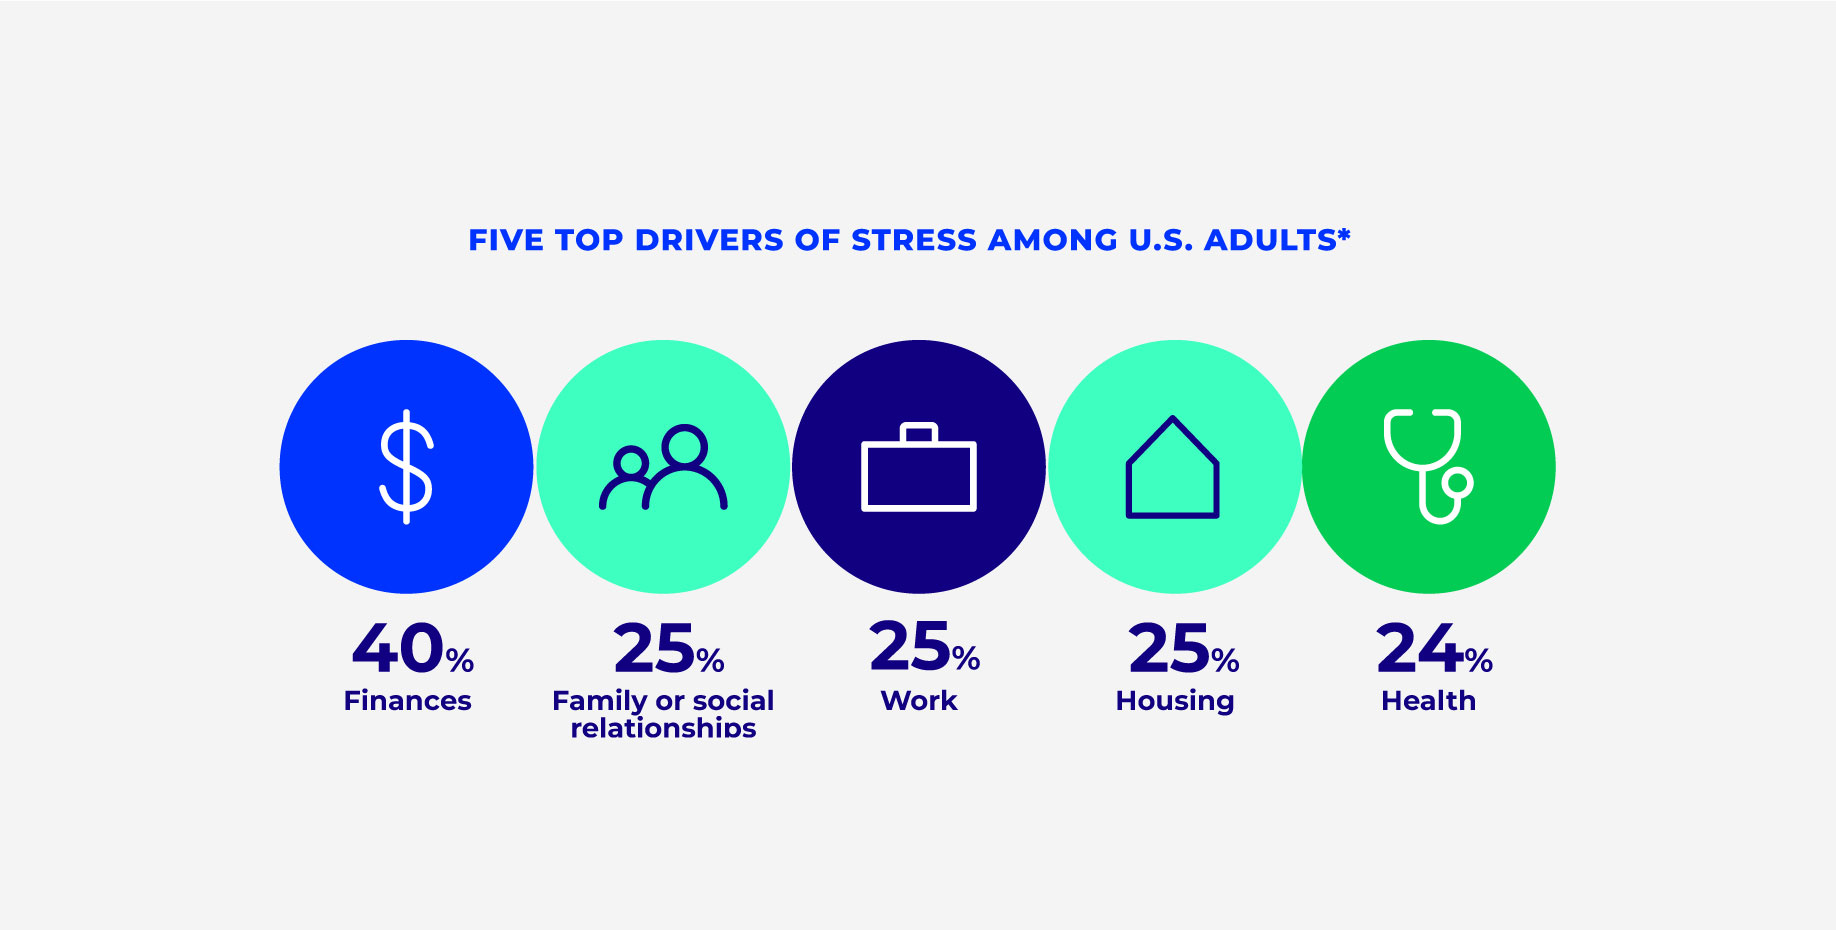
*Study participants reported experiencing stress in these areas “often” or “very often.”
Adults reporting fair or poor mental health are more likely to have received therapy from a mental health professional in the past 12 months than the general population. There is also an increase in those receiving counseling from a mental health professional from 2022 to 2023 (20% to 24%). This is encouraging year over year and demonstrates that more people are getting the help they need. For the 32% of individuals who needed mental health counseling but did not receive it, cost was the top barrier to care, followed by difficulty finding a provider, lack of appointments in a reasonable time frame, and transportation. This is exacerbated among those with poor mental health, where 68% of those who did not receive care experienced a barrier.
Generation Z adults are struggling most with their mental health, followed closely by Gen X and Millennials. Meanwhile, Baby Boomers are the most likely of all generations to rate their mental health as excellent or very good. Gen Z and Millennials are most likely to have received counseling or therapy in the past 12 months (30% and 33%, respectively). Among those who did not receive counseling, cost presents a challenge to a significantly higher proportion of Gen Z and Millennials than older cohorts.
Gen Z also lags the general population in feeling control over their future health and that their life is worthwhile, and fewer rate their quality of life as excellent, which may contribute to their overall lower mental health and vitality. They also report lower levels of feeling their life is close to their ideal, that their purpose guides what they do, and that they feel generally happy in their life.
The state of vitality among the working population
Workers enjoy higher vitality compared with their nonworking counterparts and the general population, likely because they are more likely to feel energized, armed with all the skills and tools necessary to live a healthy life, and that they have freedoms and opportunities to financially support themselves. Despite this, workers (28%) do indicate higher levels of feeling drained than nonworkers (22%) and the general population (26%).
Adults who are working enjoy better overall health than the general population, with greater engagement in healthy habits. For example, those who work are less likely to have chronic conditions than the general population (32% with no chronic conditions vs. 28%), get at least five hours of exercise per week (38% vs. 33%), and have better physical health (49% vs. 42%).
Mental health is generally similar across workers and those who do not work, though workers are more likely to have received mental health counseling in the past 12 months, likely due to greater access to mental health resources.
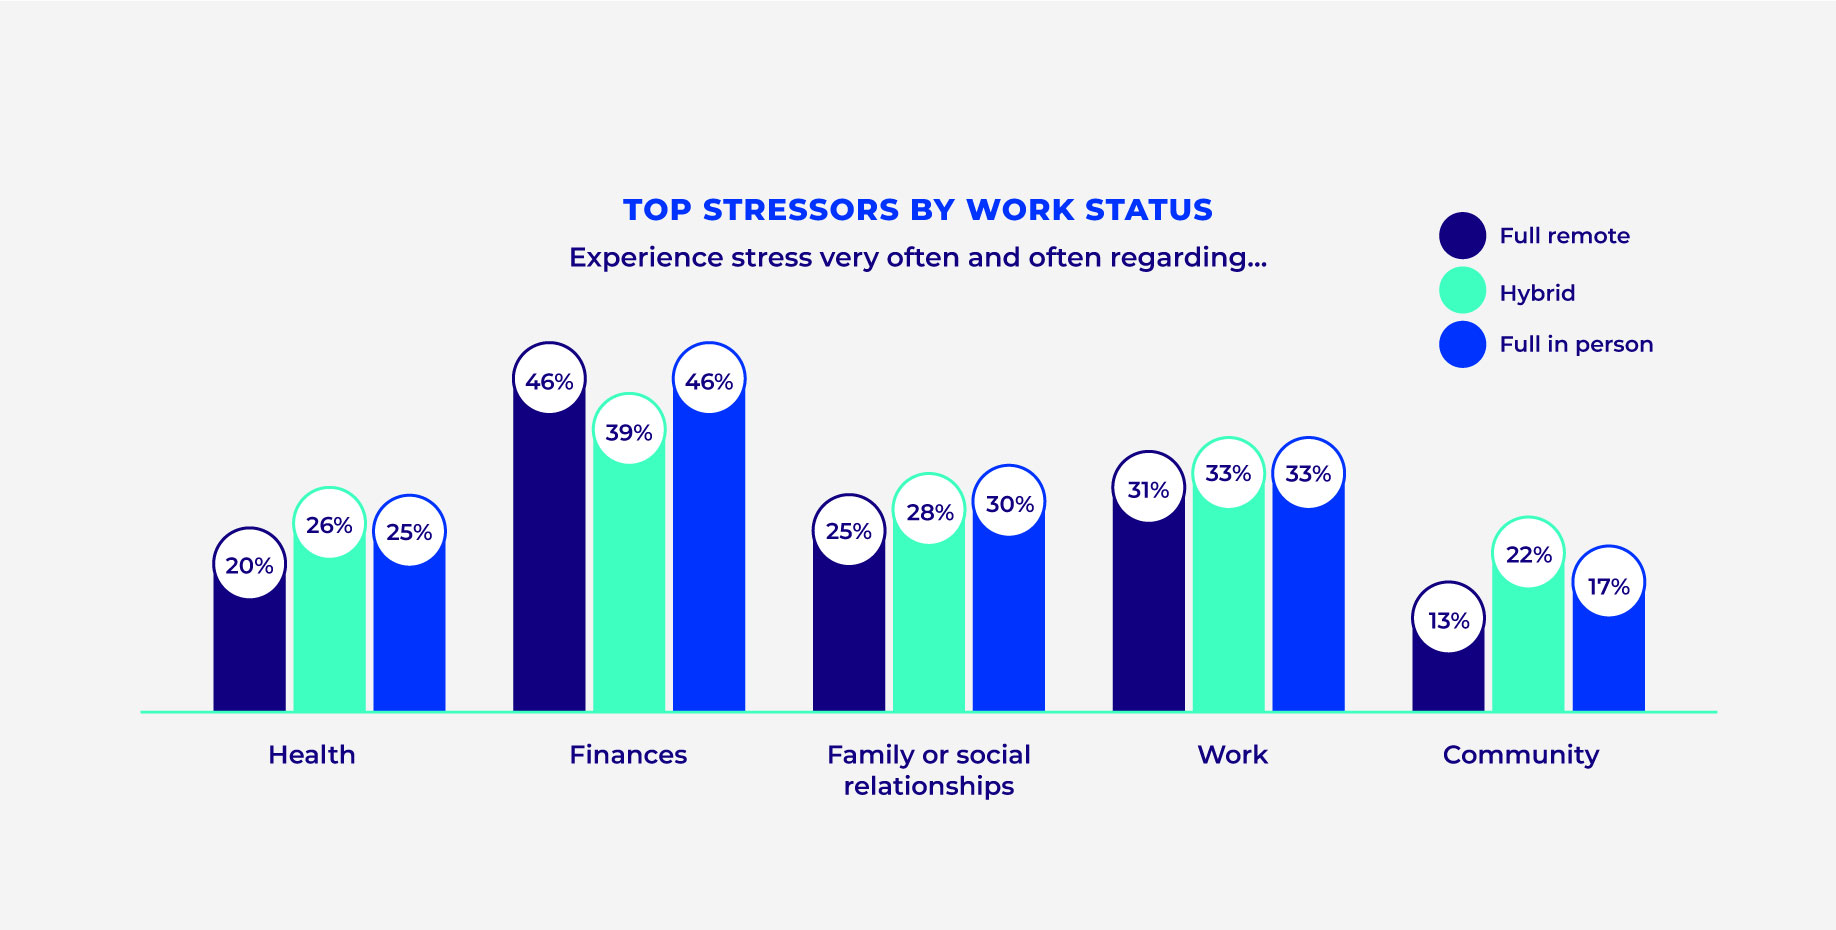
Job satisfaction and vitality are also inextricably linked, with satisfied workers having higher vitality than those who are dissatisfied with their jobs (73.9 out of 100 average vitality score vs. 55.7, respectively). Those who work in person (61%) or in hybrid work environments (60%) are more satisfied with their jobs than those who are fully remote (52%) and have higher vitality (68.9 for in person, 68.3 for hybrid, and 66.6 for remote). Hybrid workers report more healthy habits than remote and in-person workers, with better physical health, greater levels of activity, and at least one hour a day spent outdoors. Finances, work, and family or social relationships were cited as the top stressors for workers, regardless of where they work (in person vs. hybrid vs. remote).
Additionally, satisfied workers report better mental health than those who are dissatisfied (59% vs. 25%) and have lower levels of stress around their health, finances, family or social relationships, work, home, and community. They also have greater levels of overall satisfaction with their life, rate their quality of life higher, and feel happier in their life than people who are dissatisfied with their jobs.
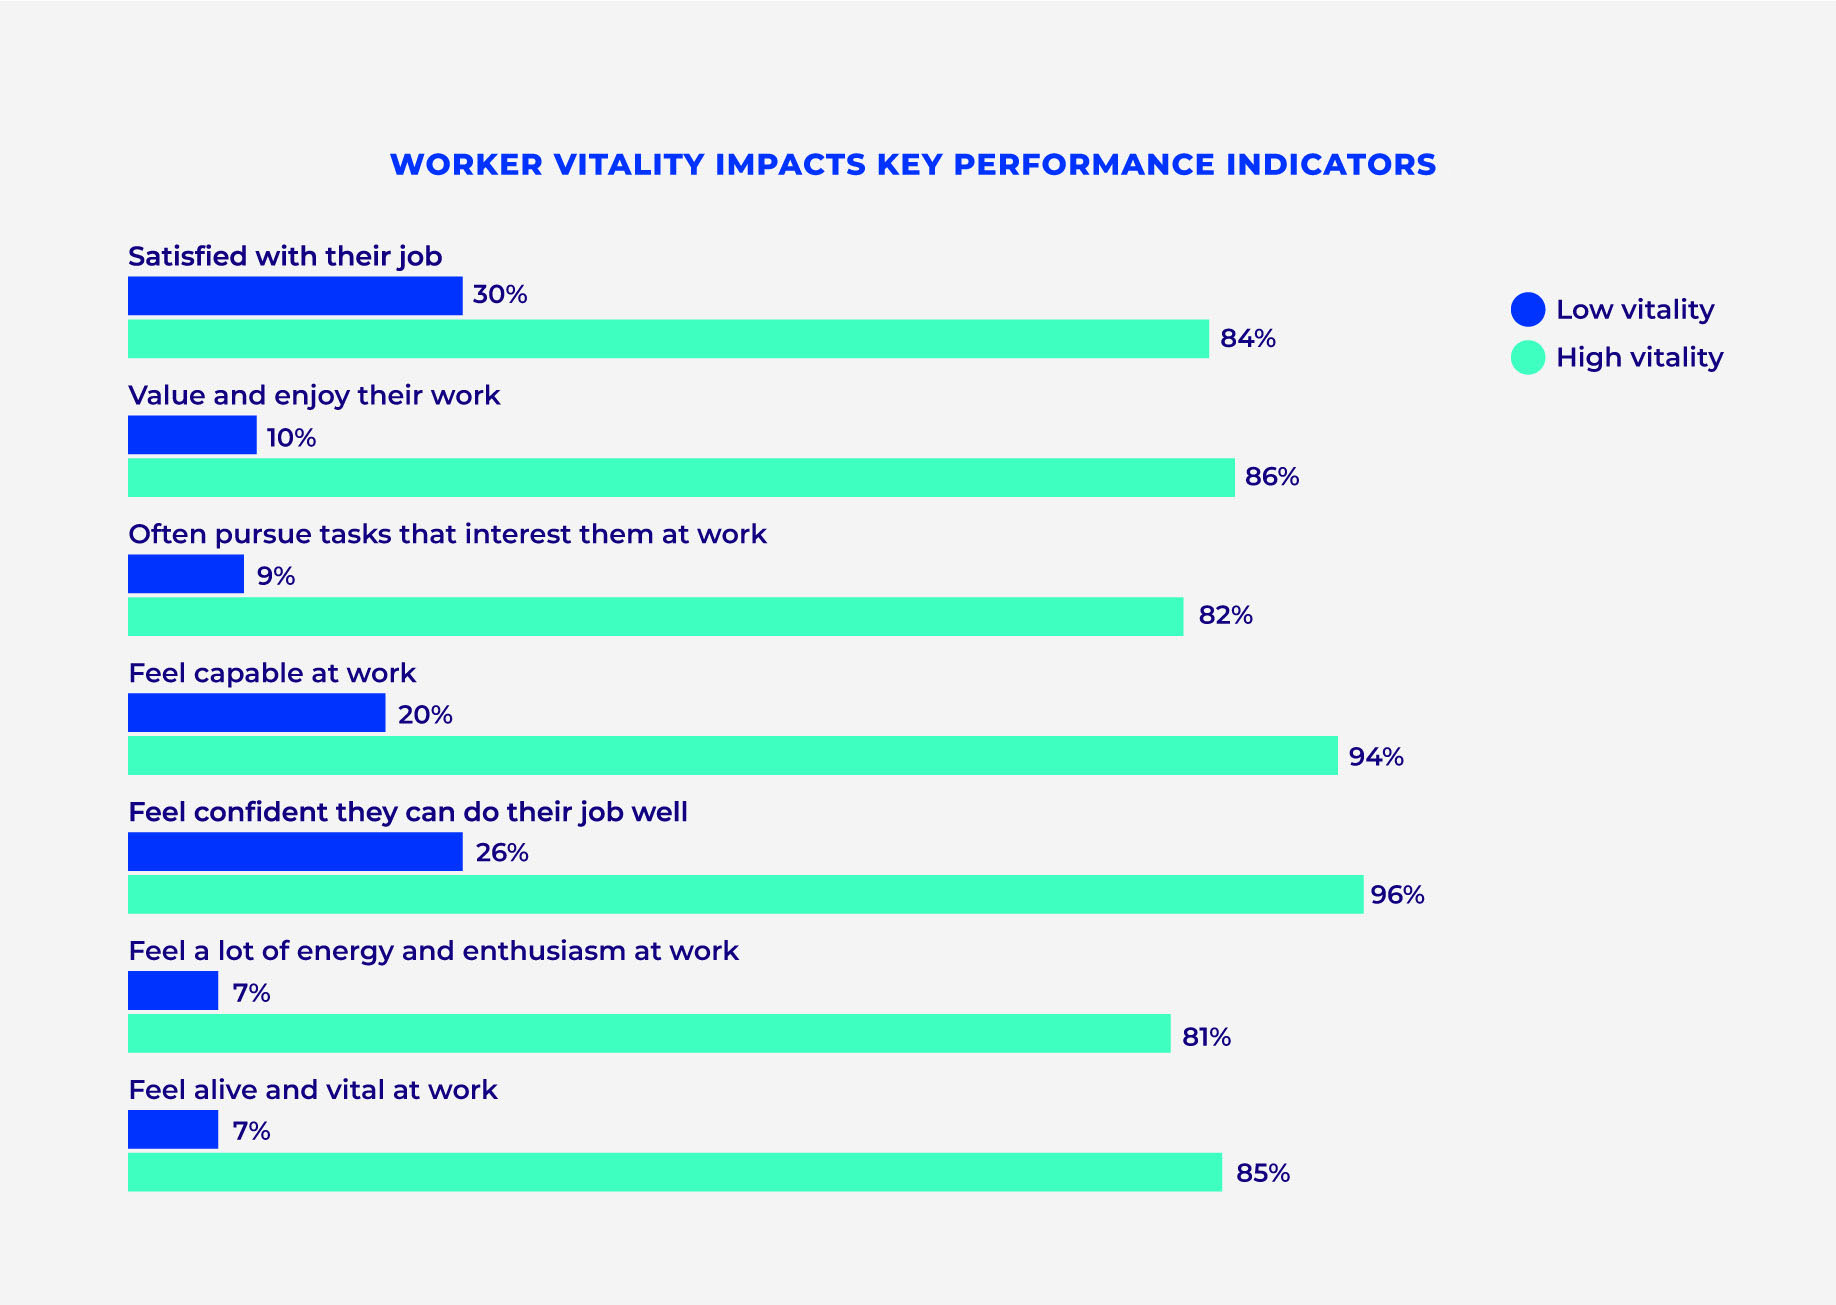
The research indicates that organizations could benefit from strategies to retain high vitality workers. Workers with high vitality are more likely than low vitality workers to enjoy their work, pursue work tasks that interest them, feel more capable at work, feel confident they can do their jobs well, feel energy and enthusiasm at work, and feel alive and vital at work. They are also more likely to perform well on the job.
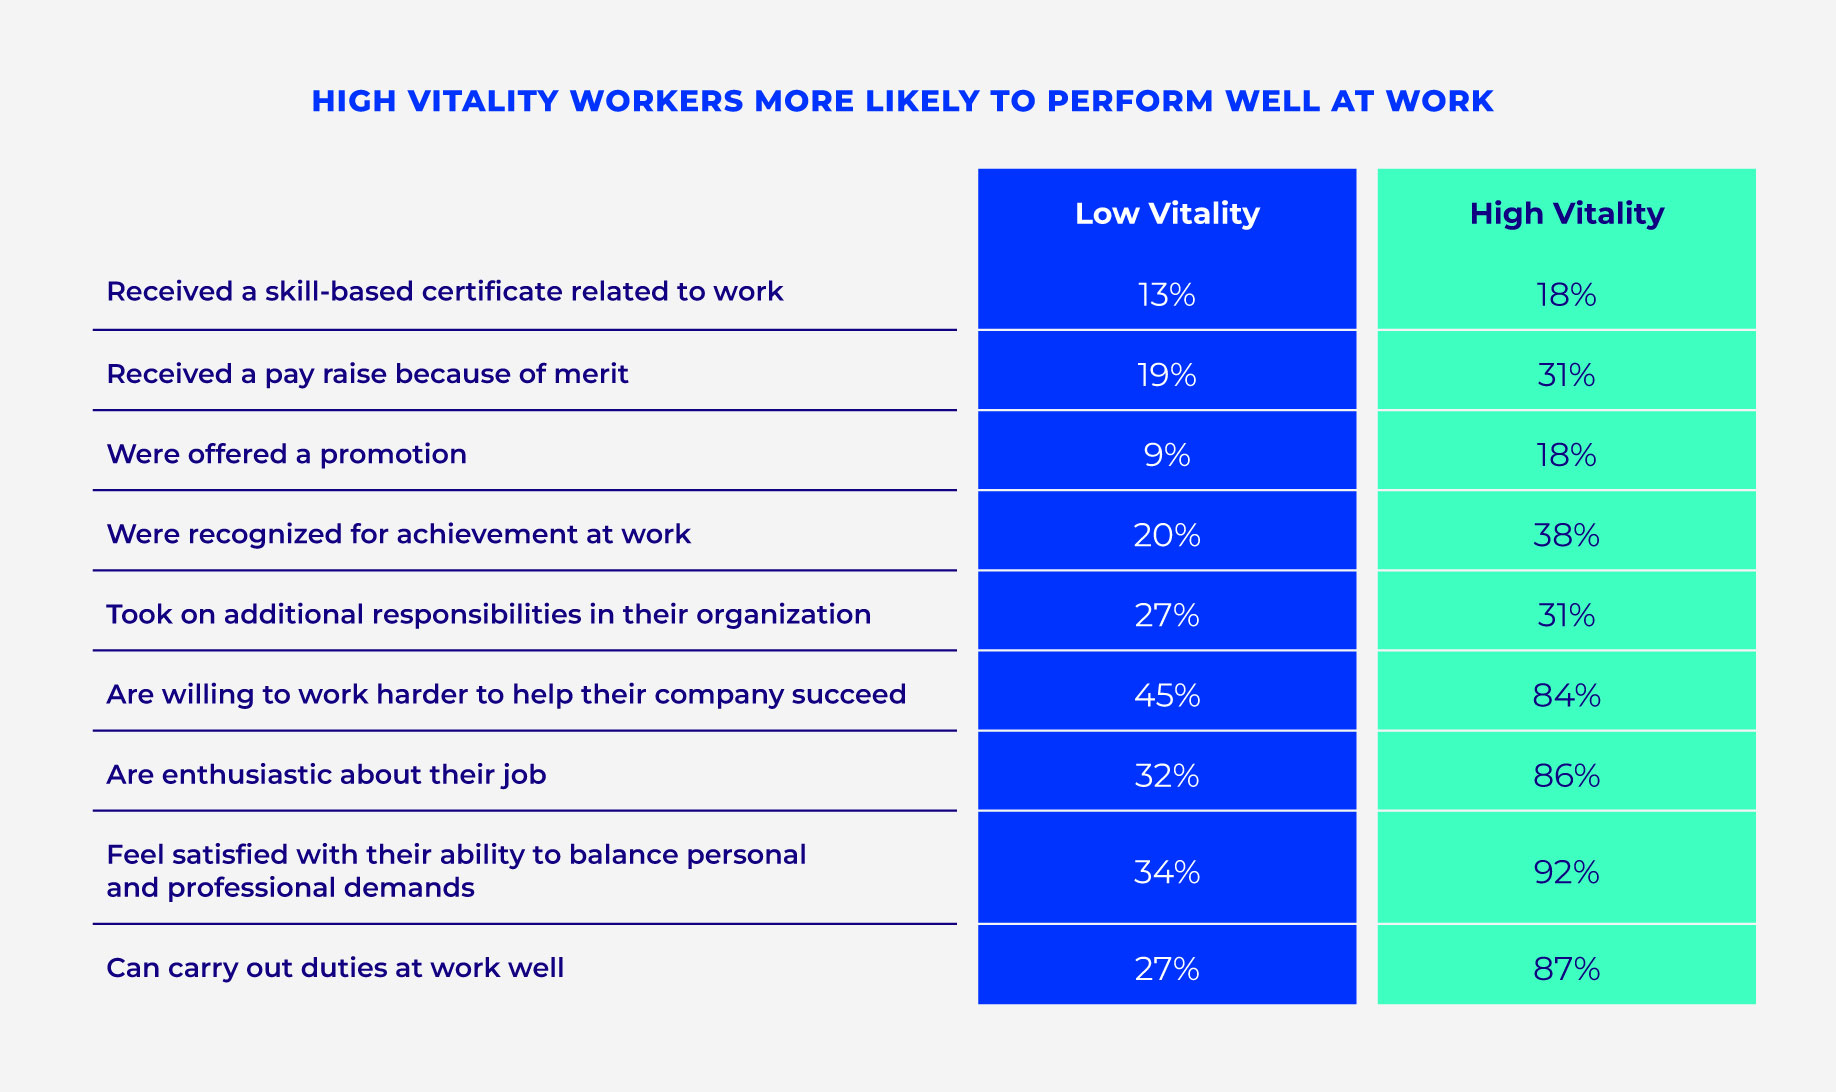
High vitality workers are also more likely than their low vitality counterparts to get growth opportunities within their company, with 31% having been offered a pay raise due to merit, 18% having been offered a promotion, and 38% having been recognized for achievement at work. Workers with high vitality are also more enthusiastic about their work and the company they work for than low vitality workers and are more willing to work harder to help their workplace succeed, highlighting their value and the importance of retaining these individuals.
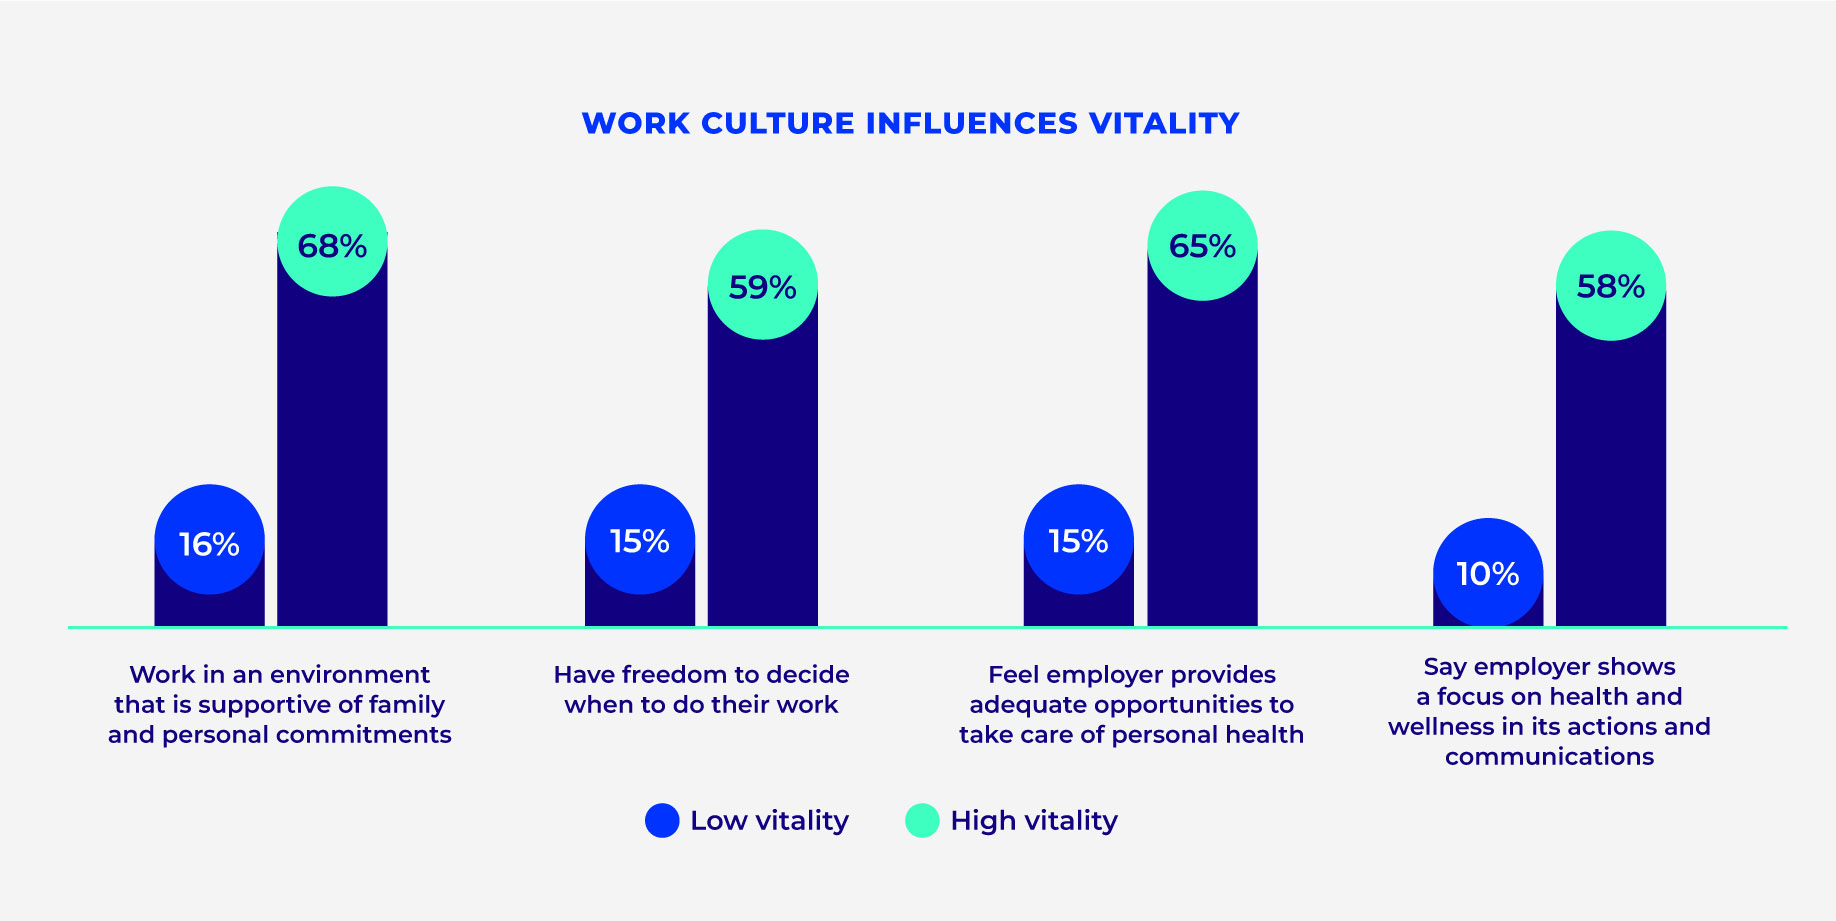
Work culture plays an important role in vitality as well. Nearly 4 in 10 employed adults report working in an environment that is supportive of their family and personal commitments. While this is higher among those with high vitality (68%), only 16% of workers with low vitality can say the same. Finally, 30% of workers say their employer shows a focus on health and wellness in its actions and communications, but only 10% of low vitality workers agree.
High vitality workers report stronger relationships with their managers and report they are more likely to:
- Feel their manager provides them choices and options (71% vs. 14%)
- Feel understood by their manager (74% vs. 17%)
- Feel encouraged by their manager to ask questions (73% vs. 20%)
- Feel their manager listens to how they would like to do things (72% vs. 16%)
- Feel their manager tries to understand how they see things before suggesting a new way to do things (68% vs. 14%)
- Feel their manager conveys confidence in their ability to do good work (79% vs. 22%)
Roughly 2 in 5 working adults indicate they are very likely or likely to consider looking for a new job in the next year. This is true for both low and high vitality workers, despite high vitality workers being satisfied with their job. In fact, high vitality workers (27%) are significantly more likely to say they are very likely to make a genuine effort to find a new job in the next year compared with low vitality workers (19%).
Finances and work are the top sources of stress for workers. Low vitality workers experience these stressors at higher rates – roughly double that of their high vitality counterparts, with a particularly high incidence of financial stress. This makes sense since low vitality workers are also more likely to earn less. Nearly 7 in 10 low vitality workers get stressed over their finances very often or often, compared with only 3 in 10 high vitality workers. Low vitality workers are also lonelier and less resilient than high vitality workers.
Despite work being a top stressor, almost half (48%) of working adults say they value and enjoy their work, with 59% saying they feel capable at their job and 63% saying they are confident they can do their job well.
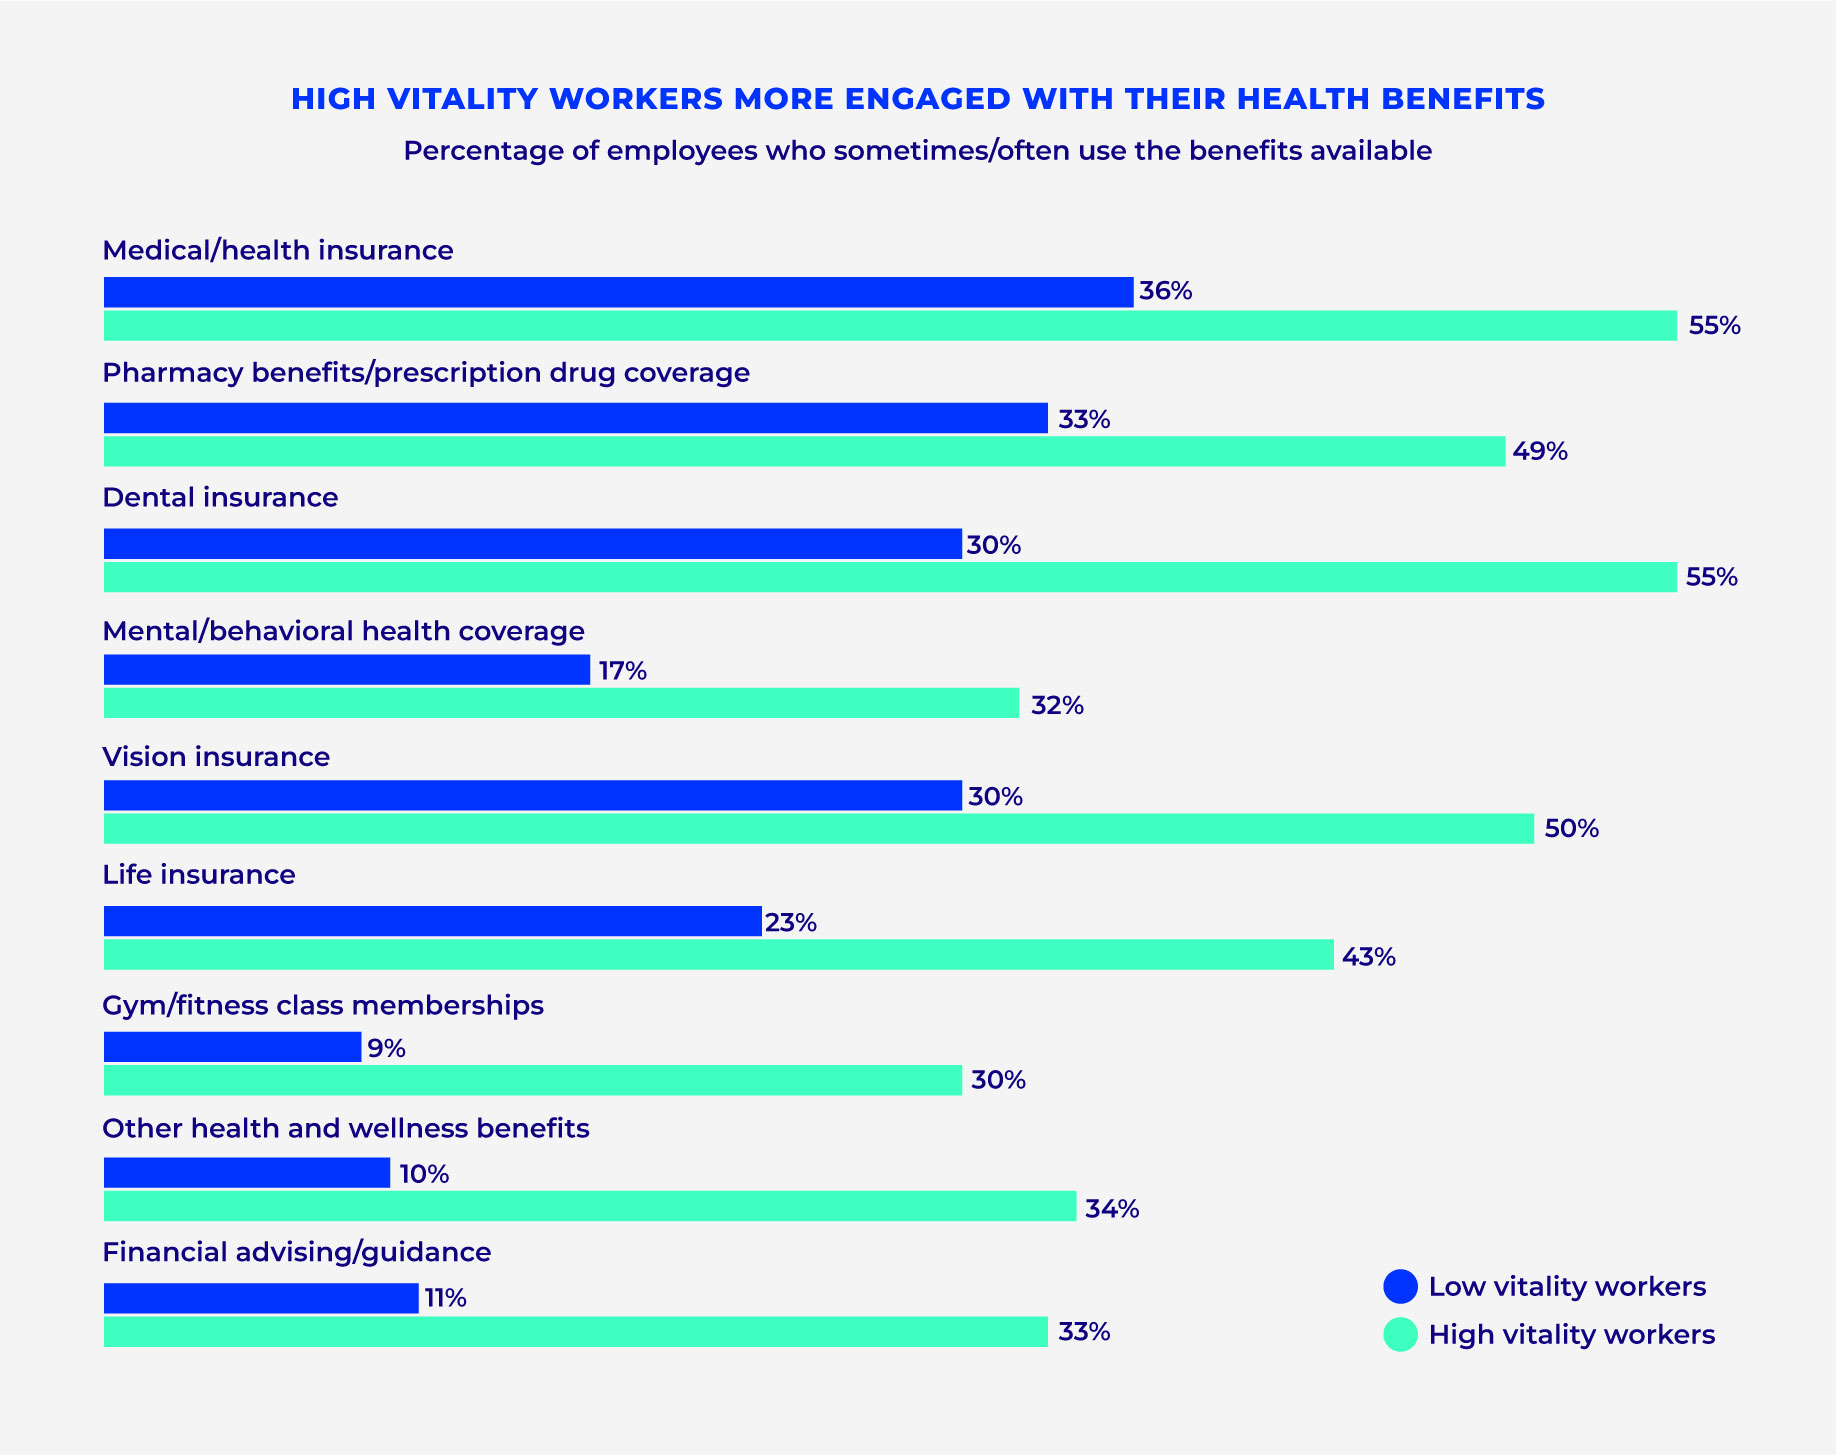
Benefits are important too. The data shows that overall, workers are satisfied with their benefits, but high vitality workers are more satisfied and more engaged with their benefits than low vitality workers. More than half of high vitality workers use their medical benefits often or sometimes vs. 36% for low vitality. This is concerning given that people who are struggling with their vitality have higher levels of stress and greater mental health care needs. Additionally, low vitality workers use their mental health benefits sometimes/often at nearly half the rate of high vitality (17% vs. 32%). This data indicates that employers could see advantages from strategies aimed at improving benefit utilization among their workforce, with a particular focus on low vitality individuals.
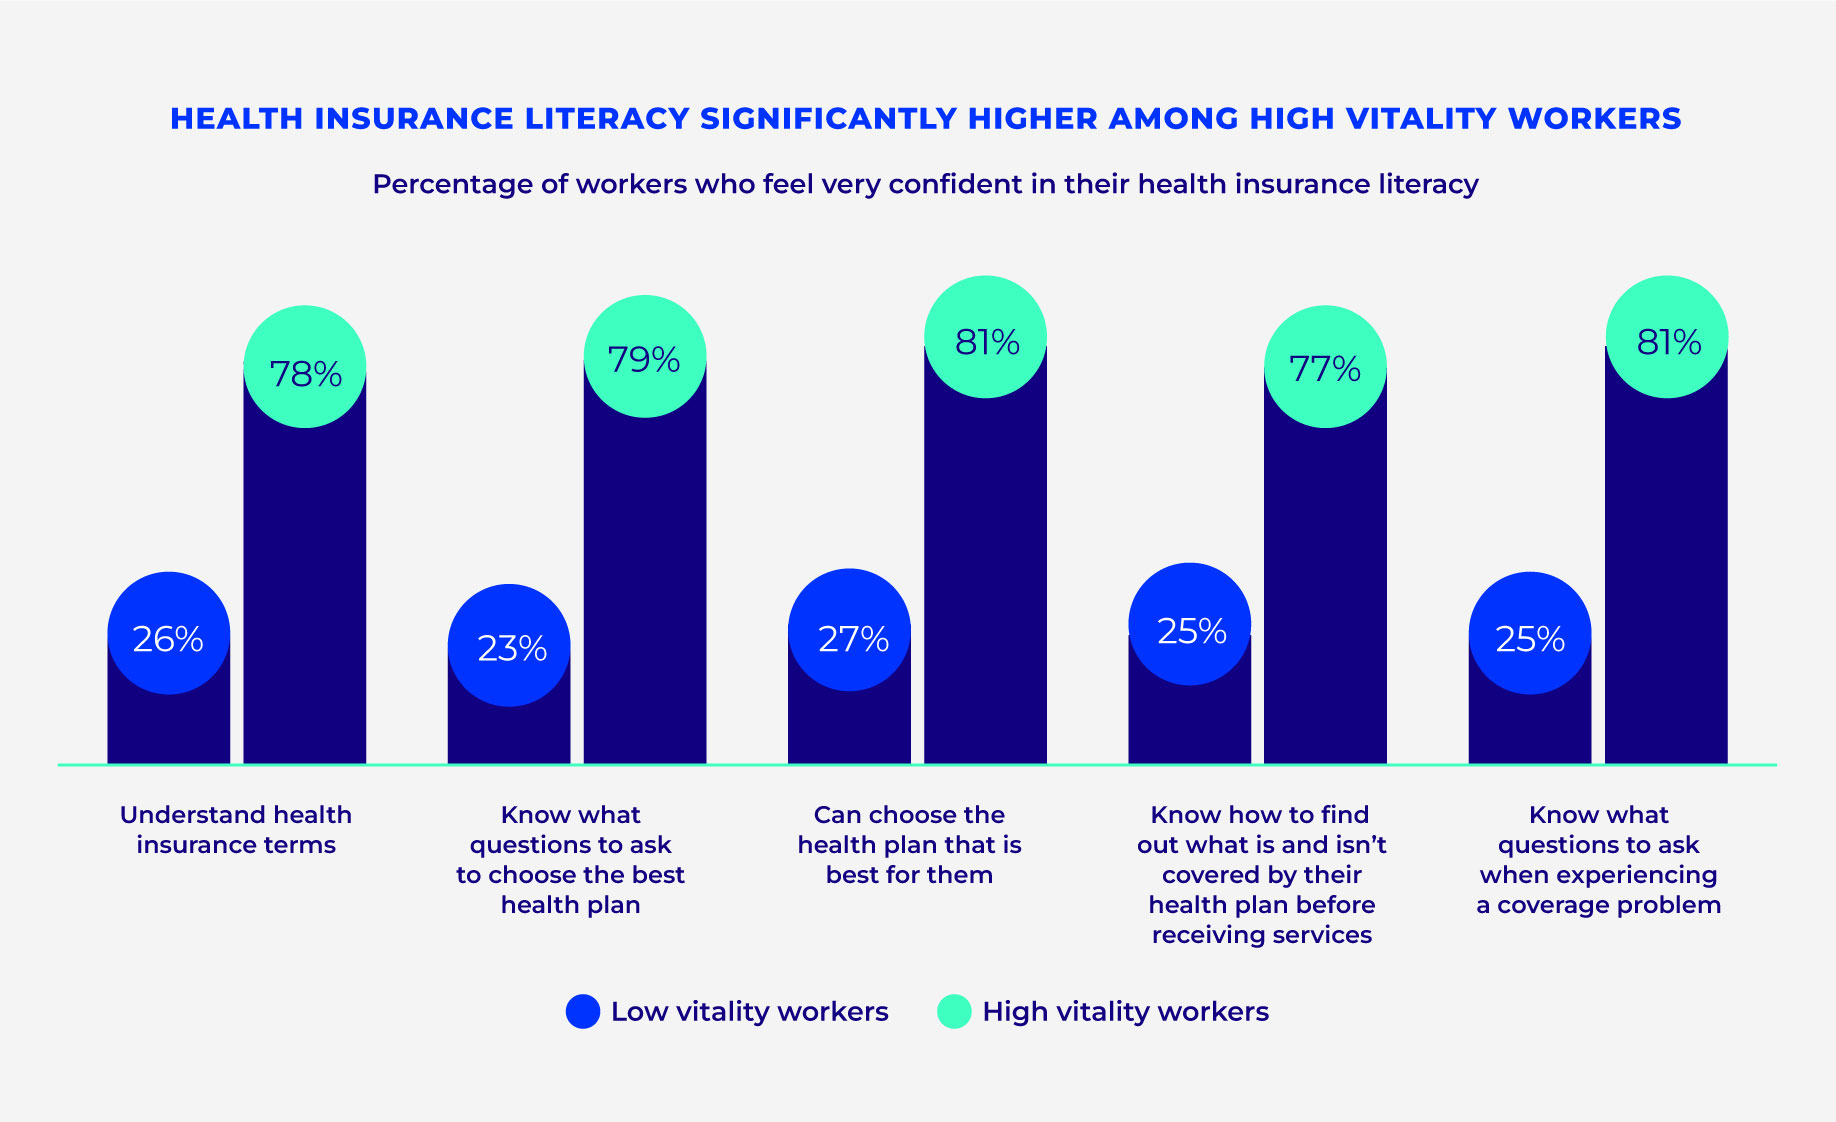
Given their higher utilization of benefits, it’s not surprising that health insurance literacy is also significantly higher among high vitality workers.
As part of our deep dive into vitality and people living with chronic condition, including cancer and depression/anxiety, we found that high vitality working adults with depression/anxiety are significantly more satisfied with their job and feel more positive about their role at work compared with low vitality counterparts. They generally feel more supported by their employer and experience a more positive managerial relationship. Of note is that high vitality does not make a person immune to work demands or time pressure – they feel this at the same rate as low vitality workers with depression/anxiety but are able to manage them differently and report higher work support. Accordingly, 95% of high vitality adults with depression/anxiety feel confident they can do their job well, compared with only 30% of those with low vitality.
Workers with high vitality living with depression/anxiety feel less stress at work than their low vitality counterparts. High vitality workers with depression or anxiety are more likely to feel enthusiastic about their job and go above and beyond to help their employer succeed, so the job stress may be there, but it is felt less acutely by those with high vitality, and it is less likely to impact their productivity.
Finally, high vitality adults with depression/anxiety were significantly more likely to feel they received appropriate recognition for good performance at work, in the form of a raise, promotion, or recognition for an achievement, in the past year.
Life stage, social needs, ethnicity, age, gender, sexual orientation, and relationship status all influence vitality
Consistent with 2022, men report higher vitality scores than women (68.8 average vitality score vs. 65.8, respectively). This may be due to the additional responsibilities associated with parenting, where women may benefit from additional support: 59% of women are parents or legal guardians vs. 54% of men.
Interestingly, Baby Boomers have the highest vitality scores – higher than all other generations and the general population. On the other hand, Gen Z has the lowest vitality, with just 12% of adults born between 1997 and 2005 reporting high vitality.
Of particular interest is the increase in well-being as age increases, despite declines in physical health. Along with the decline in physical health is a reduction in anxiety and depression among older adults.
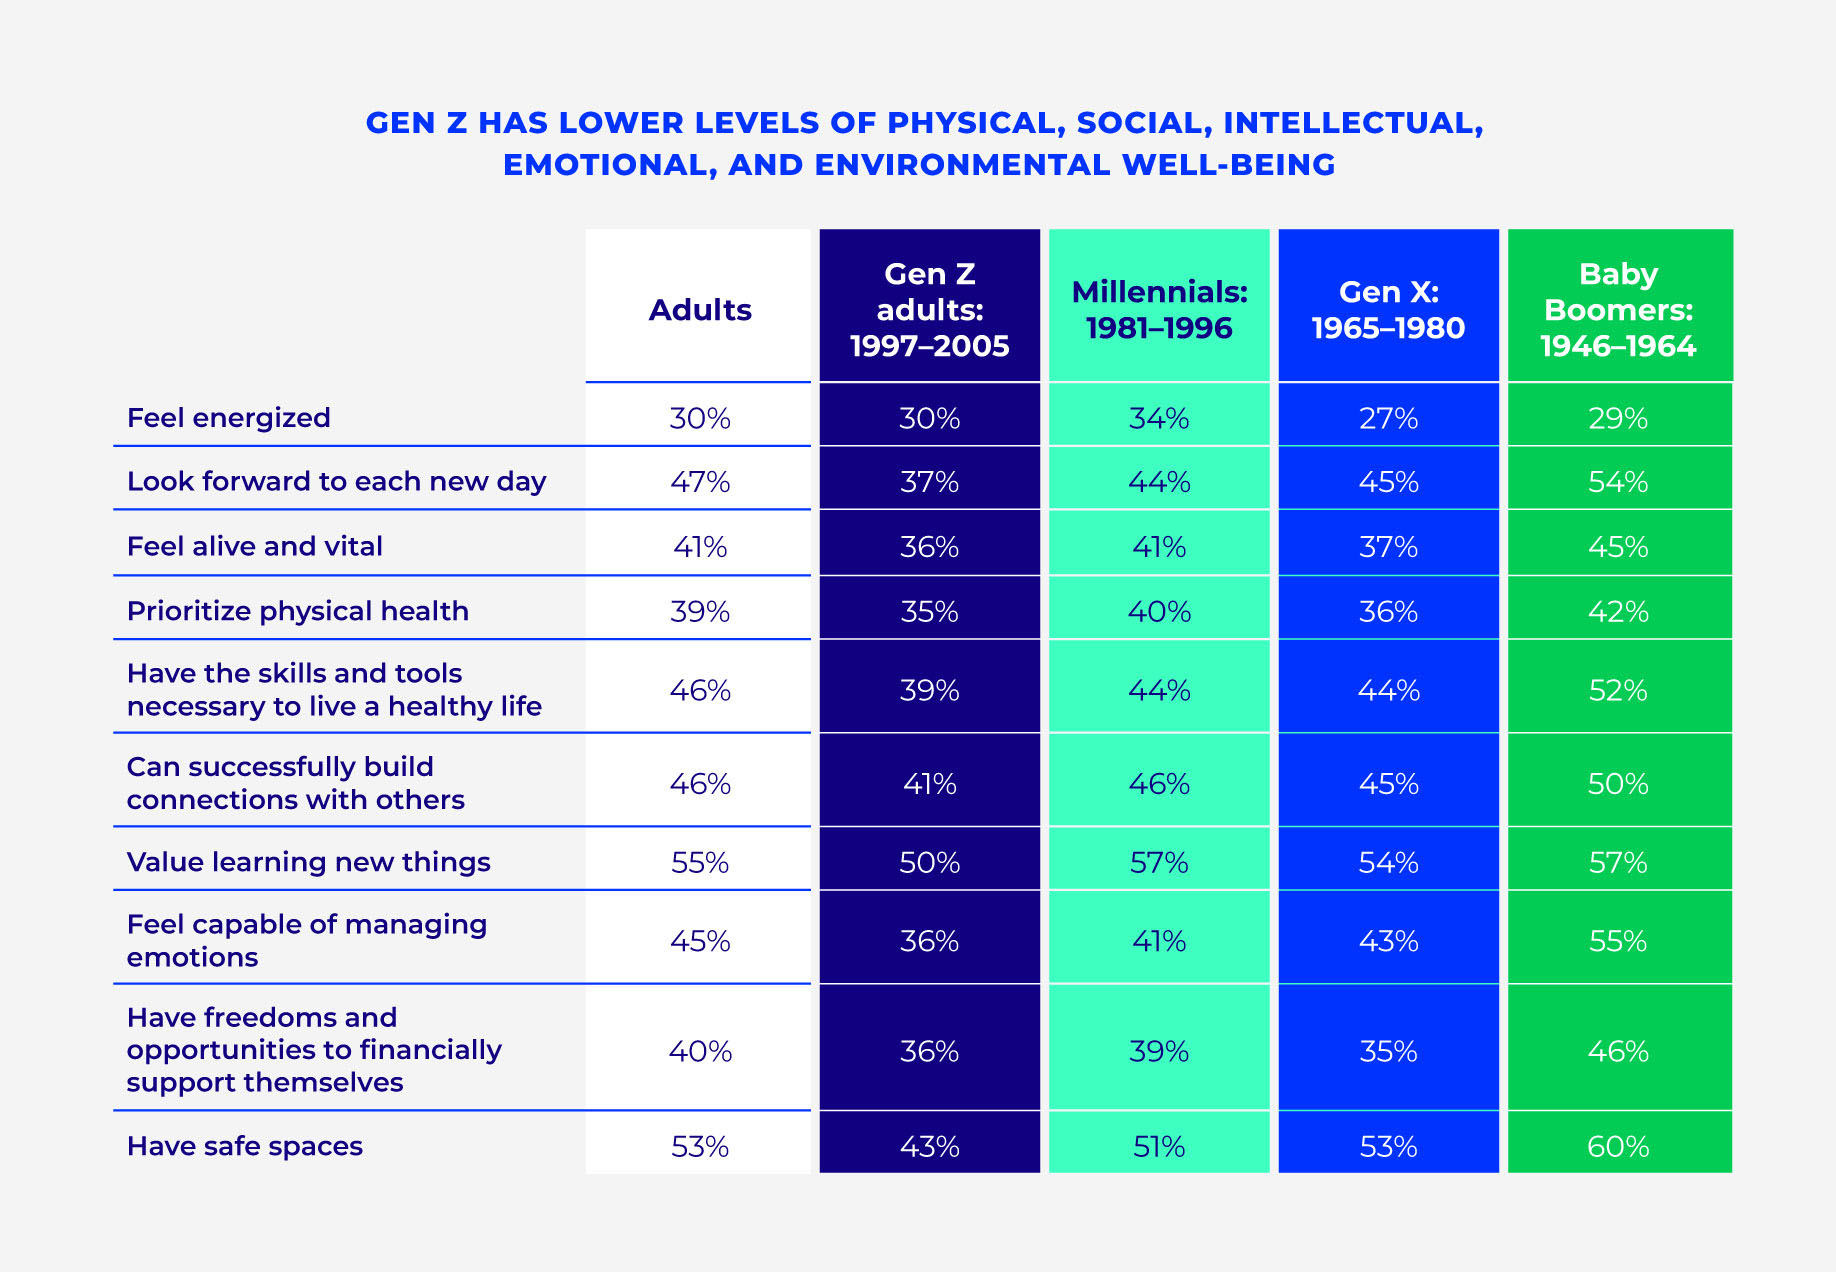
The research shows that Gen Z’s low vitality comes with lower levels of physical, social, intellectual, emotional, and environmental well-being than older generations, particularly Baby Boomers.
Relationships and parental status influence vitality. Case in point: Those who are married or living with a partner enjoy higher vitality than single adults, with stronger performance across all aspects of vitality. Interestingly, parents have higher vitality than nonparents despite similar depletion, with roughly a quarter agreeing they feel drained. This shifts depending on the stage of parenting, with those with younger children reporting significantly higher levels of depletion than those with adult children (32% vs. 18%), despite slightly higher overall vitality (Parents with children under 18: 69.6. Parents with adult children: 68.6).
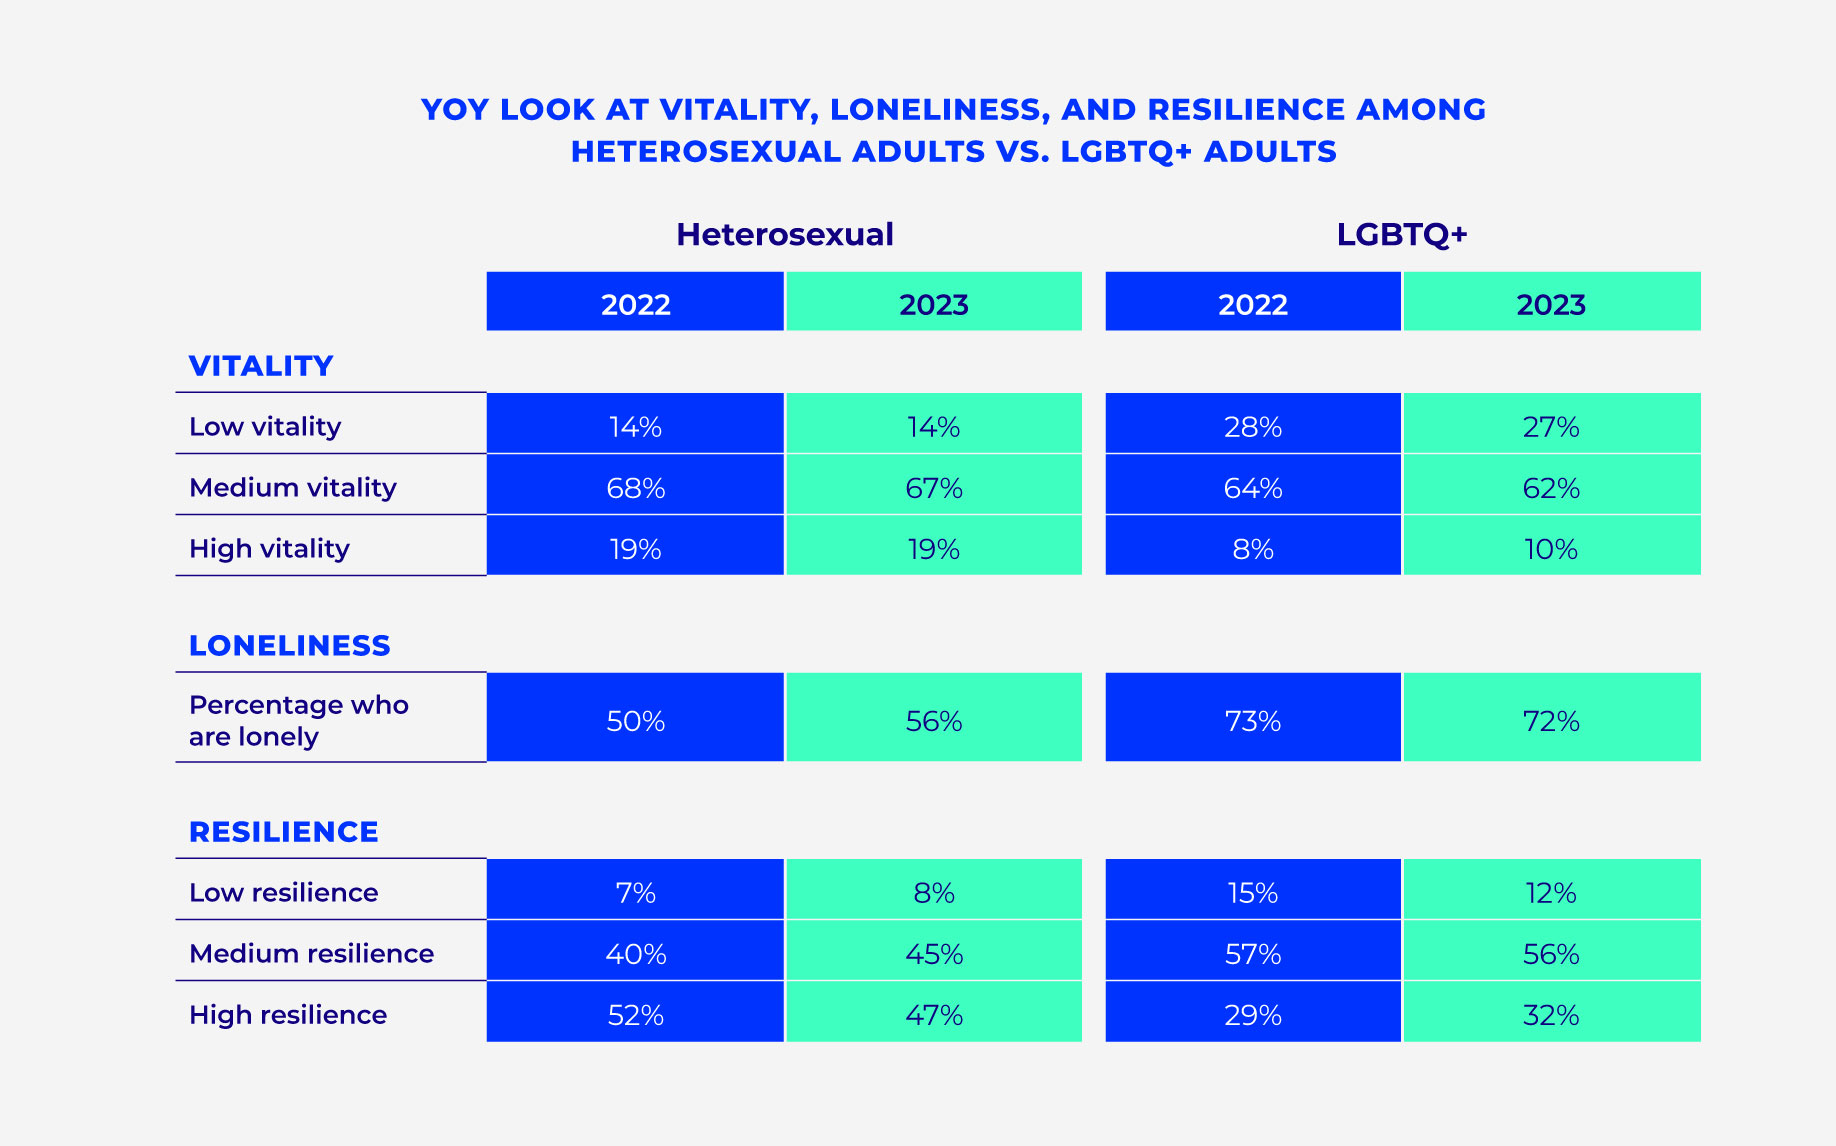
When looking at LGBTQ+ adults in this year’s study, we found that compared with heterosexual adults, LGBTQ+ adults continue to have lower levels of vitality and higher levels of loneliness. However, overall levels are stable since 2022. Vitality is stable among heterosexual adults too. However, their high resilience is softening, and their loneliness has increased relative to 2022.
LGBTQ+ adults report feeling as safe in their communities and as comfortable expressing their opinions as last year, while heterosexuals feel less so.
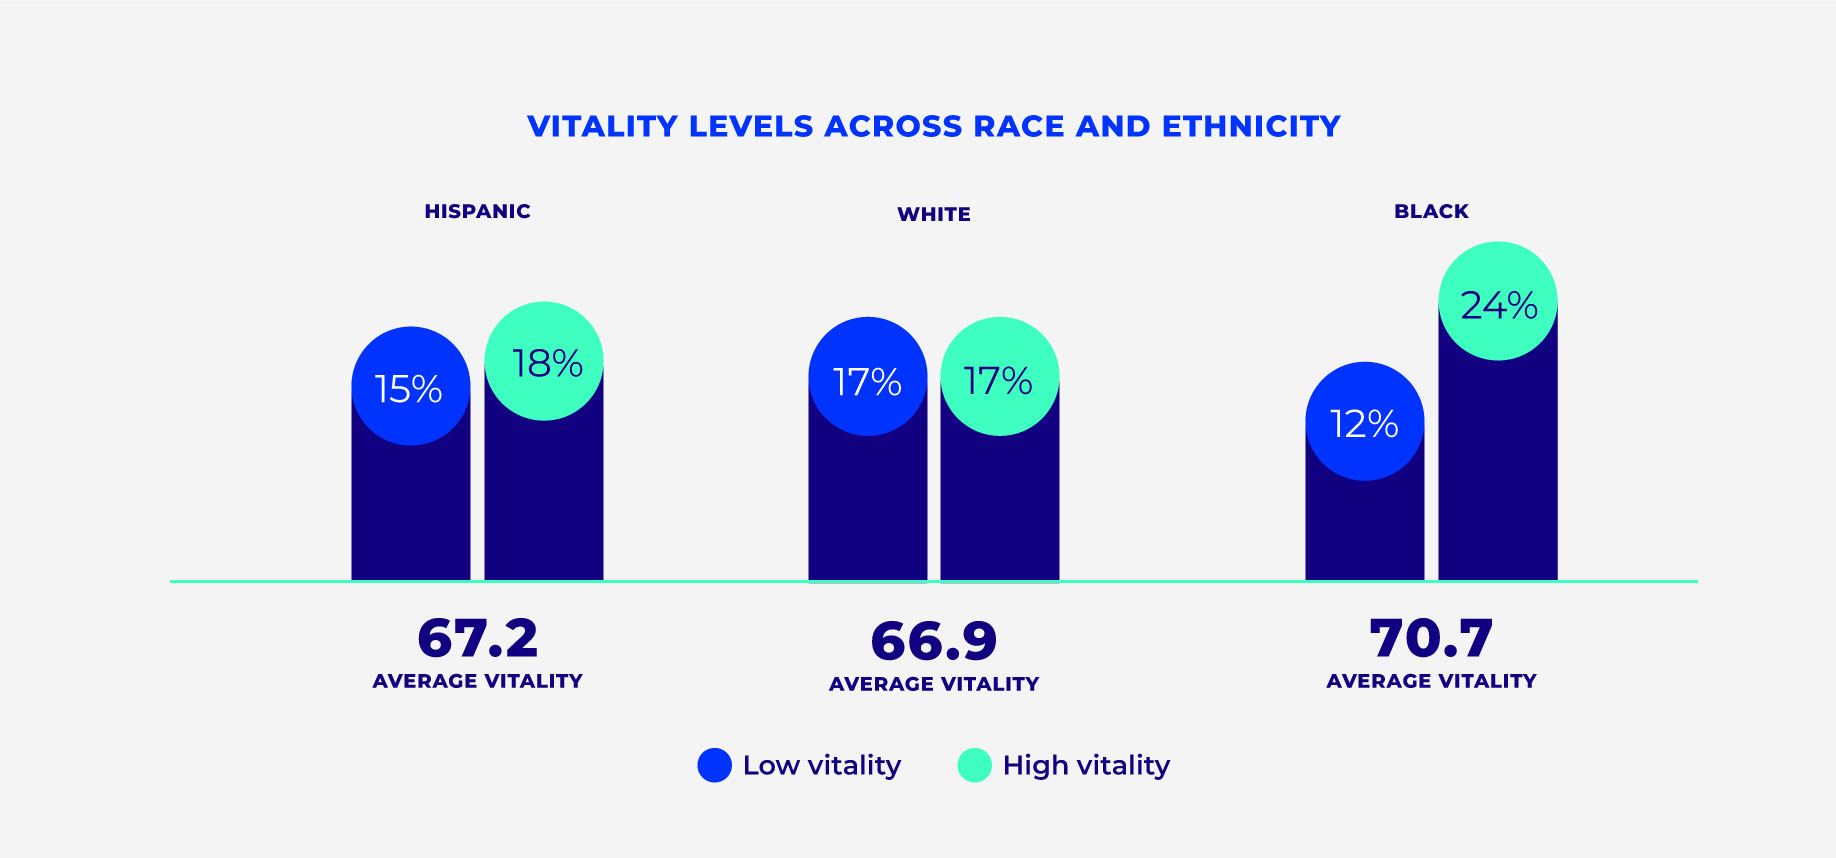
One surprising finding in this year’s research was that the Black community has higher vitality (70.7) than whites (66.9) and Hispanics (67.2). Even within low vitality groups, Black people have directionally higher vitality than whites (37.5 vs. 36.5). Black adults are significantly more likely to feel alive, vital, and energized and are looking forward to each day more than in 2022.
High vitality Black adults are more likely to be married (29% high vitality vs. 19% low vitality). Some other characteristics we uncovered include:
- High vitality Black adults are more likely to have insurance coverage than low vitality Black adults (85% vs 77%).
- High vitality Black adults fall into a higher income bracket than their low vitality counterparts.
- 11% of high vitality Black adults hold a post-graduate degree, significantly higher than low vitality Black adults (3%).
Meanwhile, low vitality Black adults have lower levels of physical health and are engaged in less physical activity than their high vitality counterparts. They are less likely to eat fruit once a day (12% vs. 43% for high vitality), and they get less
sleep than their high vitality counterparts (32% with low vitality get less than four hours of sleep per night vs. just 11% for high vitality).
Low vitality Black adults are also significantly more likely than their high vitality counterparts to indicate they have a chronic condition (65% vs. 51%). Specifically, they are significantly more likely to experience clinical depression and anxiety (32% vs. 8%).
Low vitality Black adults are less likely than their high vitality counterparts to have a primary care provider (49% vs. 77%) and are less likely to have seen a doctor for an annual check-up in the last year (50% vs. 76%). With this comes lower levels of health literacy for low vitality Black people.
All in all, high vitality Black adults feel more satisfied with their life, exhibit higher resilience, and feel less lonely than low vitality Black adults, in part due to greater familial support and belonging in their community.
Interestingly, high vitality Black and Hispanic adults are more likely to fall into the 18- to 34-year-old category (41% and 39%, respectively) than their white counterparts (13%).
In line with their higher incomes, white people with high vitality report feeling stress about their finances less often than Black and Hispanic people (22% of whites with high vitality feel stress about their finances very often/often vs 28% of Black people and 31% of Hispanics).
Key insights on vitality and adults in the U.S.
- Overall, vitality levels are flat year over year. However, adults in 2023 are lonelier than they were last year, and their resilience is declining. They are also dealing with stress around their finances and grappling with declines in their mental health and physical health compared with 2022.
- There are many bright spots in this year’s research: Historically low vitality groups, such as Gen Z, Black people, and LGBTQ+ adults, are not experiencing the same levels of decline across vitality and resilience or an uptick in loneliness. Instead, these cohorts report feeling more alive and vital, with an optimistic view of their life (looking forward to each new day), compared with 2022. Also surprising in this year’s research is the positive outlook of high vitality adults who are living with chronic conditions, such as cancer or depression/anxiety.
- Though Gen Z continues to report the lowest levels of vitality, they are gaining ground in building vitality while other generations stagnate or decline. Relatedly, Gen Z indicates higher levels of energy and optimism in 2023.
- Work environments that support vitality result in more motivated and engaged workers. We’re seeing stark differences in vitality across several dimensions of health and well-being when it comes to the working population vs. nonworkers. Workers are healthier, more fulfilled, more likely to have higher vitality, and more likely to have health insurance literacy. The research finds that high vitality workers perform best on the job and suggests that employers could benefit from strategies to retain high vitality workers.
- Consistent with 2022, men have higher vitality than women. However, women are feeling more alive and vital and are more likely to look forward to each day versus 2022, despite being twice as likely to suffer clinical depression as men (a significant increase vs. 2022). Meanwhile, men are seeing a small decline in their vitality and are seeking ways to help improve and maintain it.
- Compared with heterosexual adults, LGBTQ+ adults continue to indicate lower levels of vitality and resilience, yet overall levels are trending upwards. In 2023, LGBTQ+ adults are more likely to feel alive and vital and say they look forward to each new day. Across health and wellness metrics, LGBTQ+ adults are stable with 2022 while heterosexual adults show a decline.
- For white adults, vitality is trending downwards and resilience is declining, and they are significantly more likely to say they are lonely. Conversely, Black adults are more vital and less lonely in 2023 than they were in 2022.

Chapter 2: The state of vitality among Gen Z adults in the U.S.
In addition to the main vitality survey fielded among the general population, an additional survey was conducted among 4,000 people to better understand the vitality of Generation Z adults – the cohort born between 1997 and 2005.