
Vitality: The Next Generation Measure of Health
The pandemic put a spotlight on the importance of health and well-being like never before. Stress, burnout, and loneliness were amplified, mental health concerns were exacerbated, and the fragility of our physical health became more apparent. In addition, the impacts of social determinants of health, such as income, education, where someone lives, and access to health care, became more pronounced. All of these factors, and more, influence the way we feel, live, and work.
As we move forward, it’s critical to recognize that our overall health and well-being are dynamic and multi-dimensional. Well-being is more than physical and mental health. It is everything that impacts our ability to pursue life with health, strength, and energy – our vitality. We need a new, more substantive health measure to help us achieve the best versions of ourselves.
Vitality is a driver and an outcome of health and work/life engagement, and we believe it is not only essential to individuals, but is also a catalyst for business and community growth. By measuring, predicting, and influencing vitality, we can inspire the personal, economic, and business growth that are hallmarks of a healthy society.
Together with psychologist Dr. Richard Ryan, the world’s foremost authority on the science of vitality, we developed a scientifically validated, proprietary measure of whole-person health – the Evernorth Vitality Index. Vitality gives us the ability to better understand health and well-being as they truly exist: composed of multiple, interdependent, dynamic dimensions. Vitality accounts for eight dimensions of health – financial, physical, emotional, social, intellectual, environmental, spiritual, and occupational.
Importantly, it also accounts for how people feel about their ability to make their own choices and be in control of their life across those dimensions – known as one’s autonomy, competency, and relatedness. The index then calculates the data to present as a single, comprehensive measure of whole-person health.
Using the Evernorth Vitality Index, we conducted an online survey of more than 10,000 adults across the United States – making this the largest study ever conducted on vitality, health, and productivity. It was fielded May 17-June 9, 2022, by Morning Consult.
Keep scrolling for the full report, or download it as a PDF
Prefer to read this content in PDF format? We've got you covered. Click to download below, or keep scrolling to view the full findings.
Table of Contents
- Vitality in the United States: Top Research Findings
- Vitality and Life Stage
- Gender, Gender Identity, and Sexual Orientation Impact Vitality
- Vitality and Socioeconomic Divides
- Vitality's Impact on the Body and Mind
- The Bright Spots: Living With Vitality Despite Challenges
- The High-Vitality Individual With Lower Income
- The High-Vitality Rural Resident
Vitality in the United States: Top Research Findings
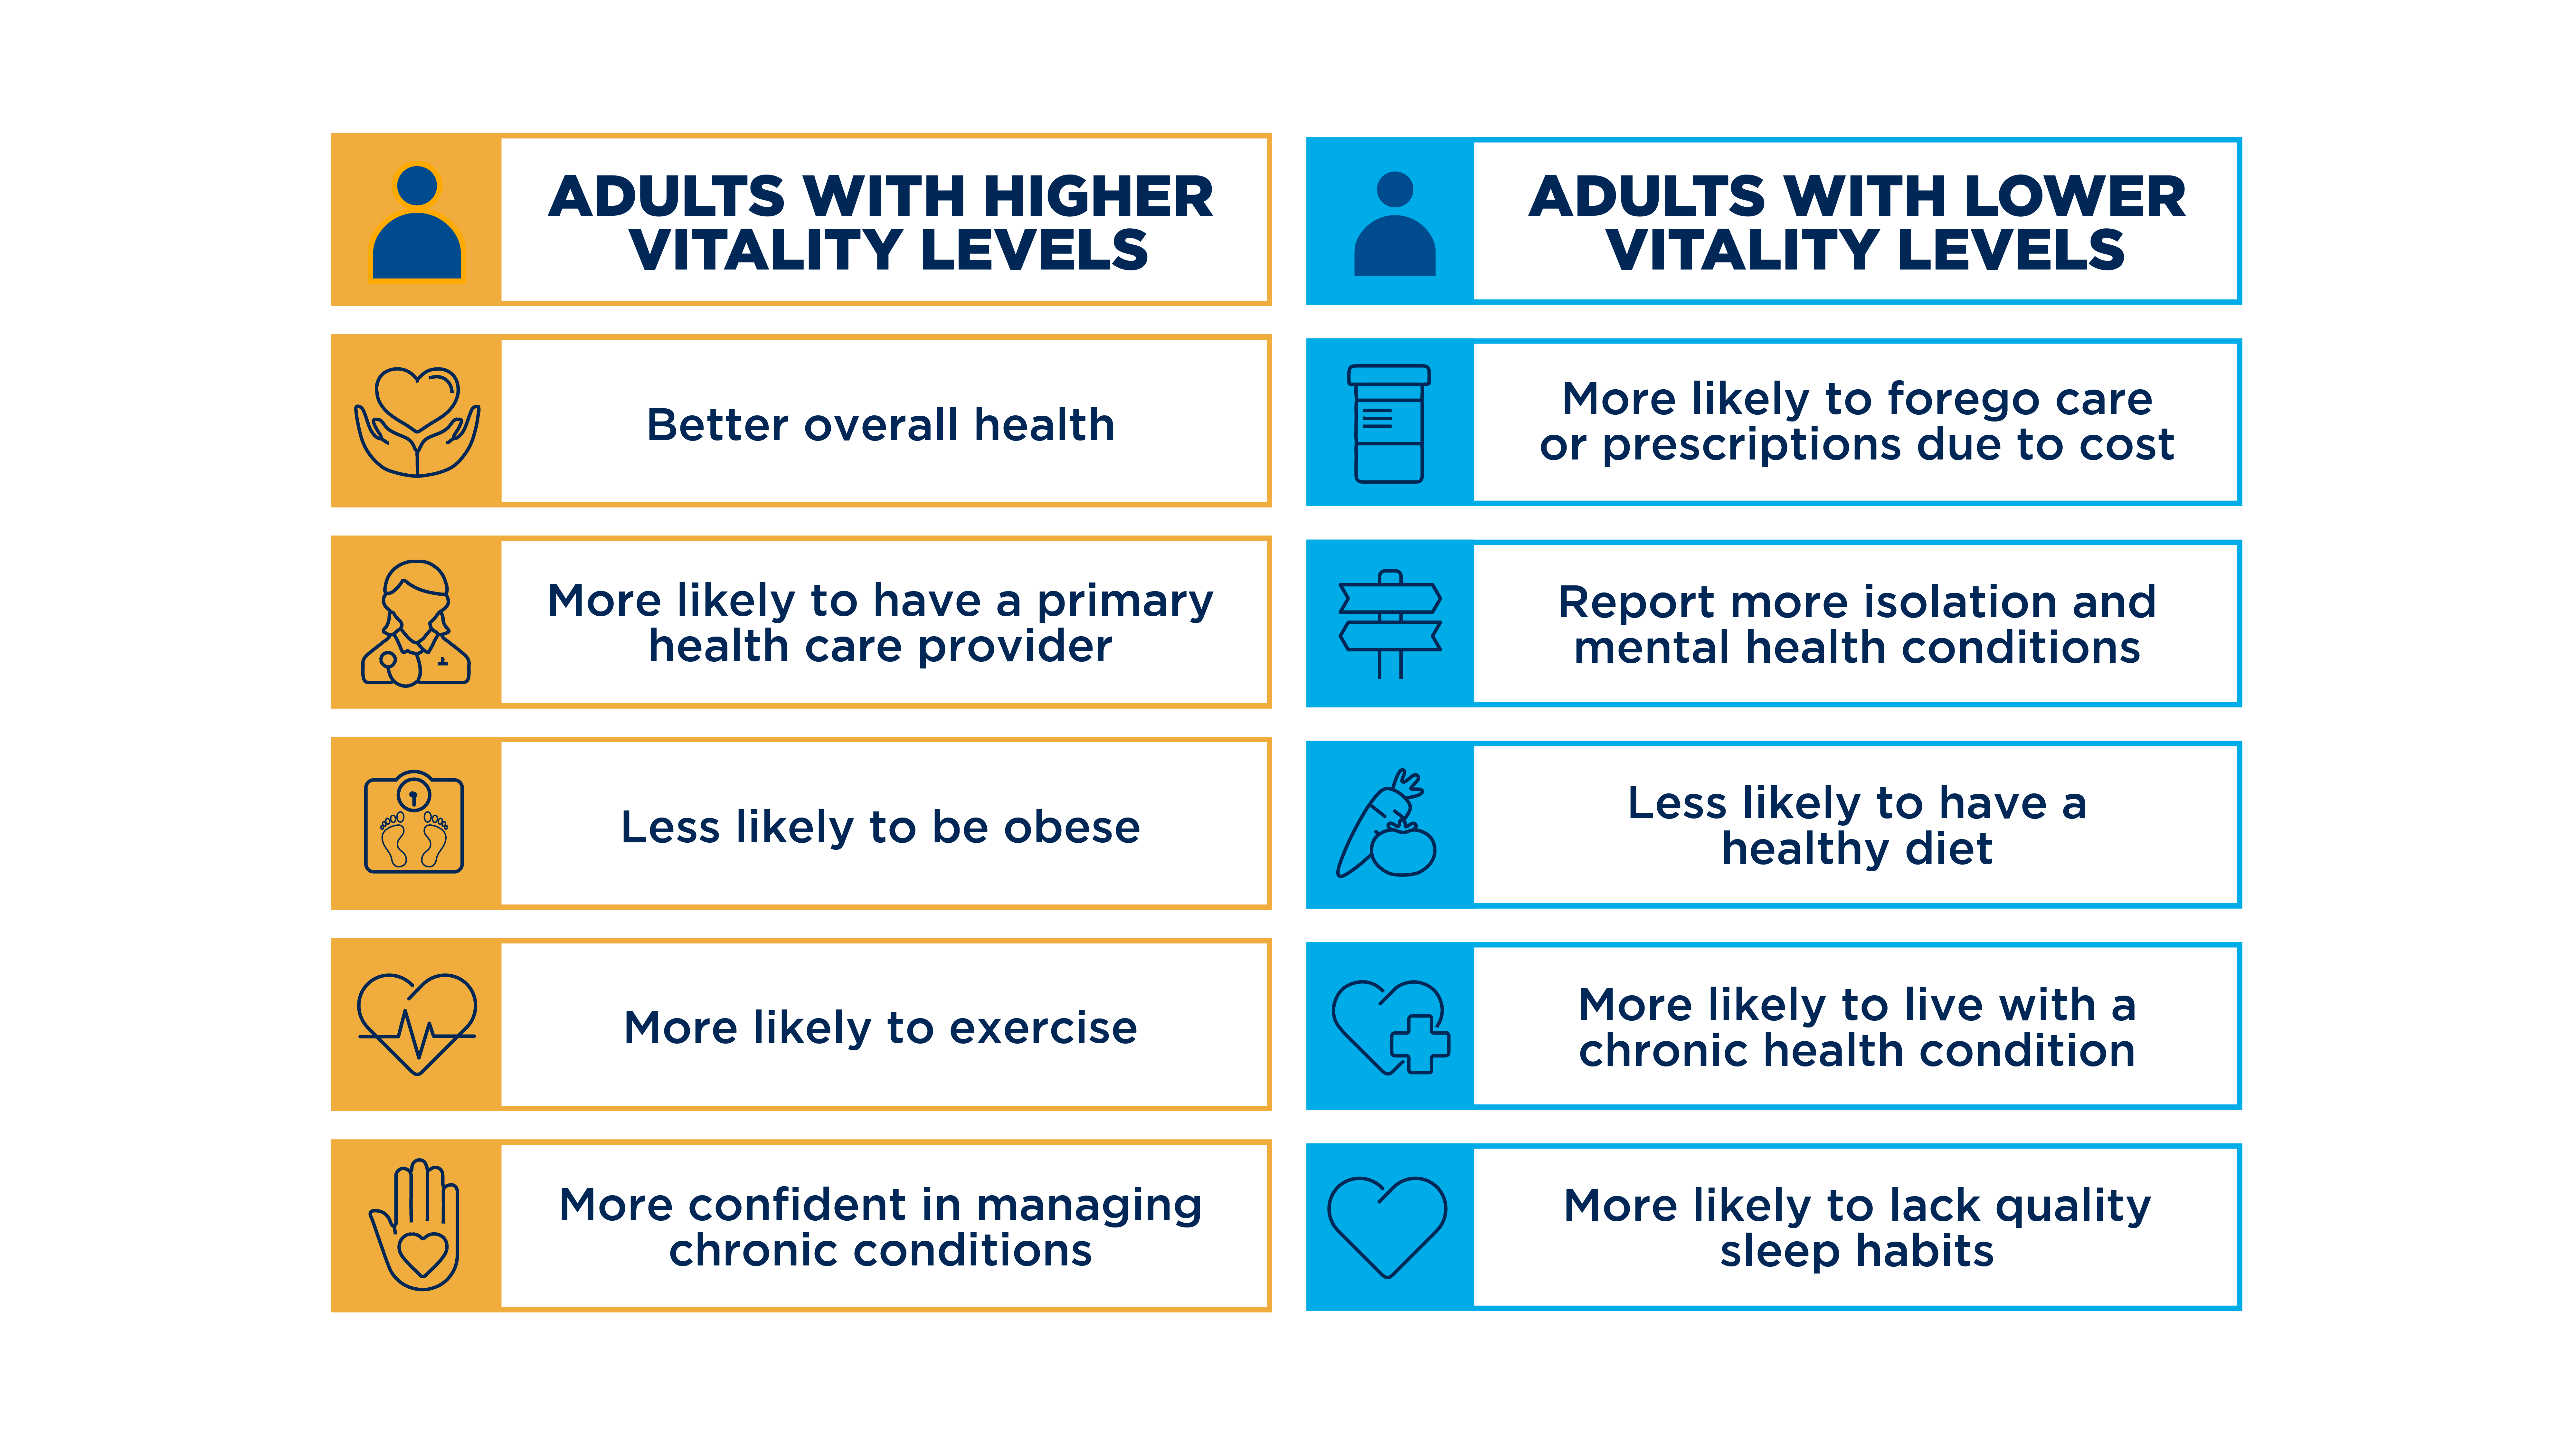
The research confirmed that those with higher vitality experience a wide range of benefits, from better mental and physical health to higher levels of job satisfaction and performance.
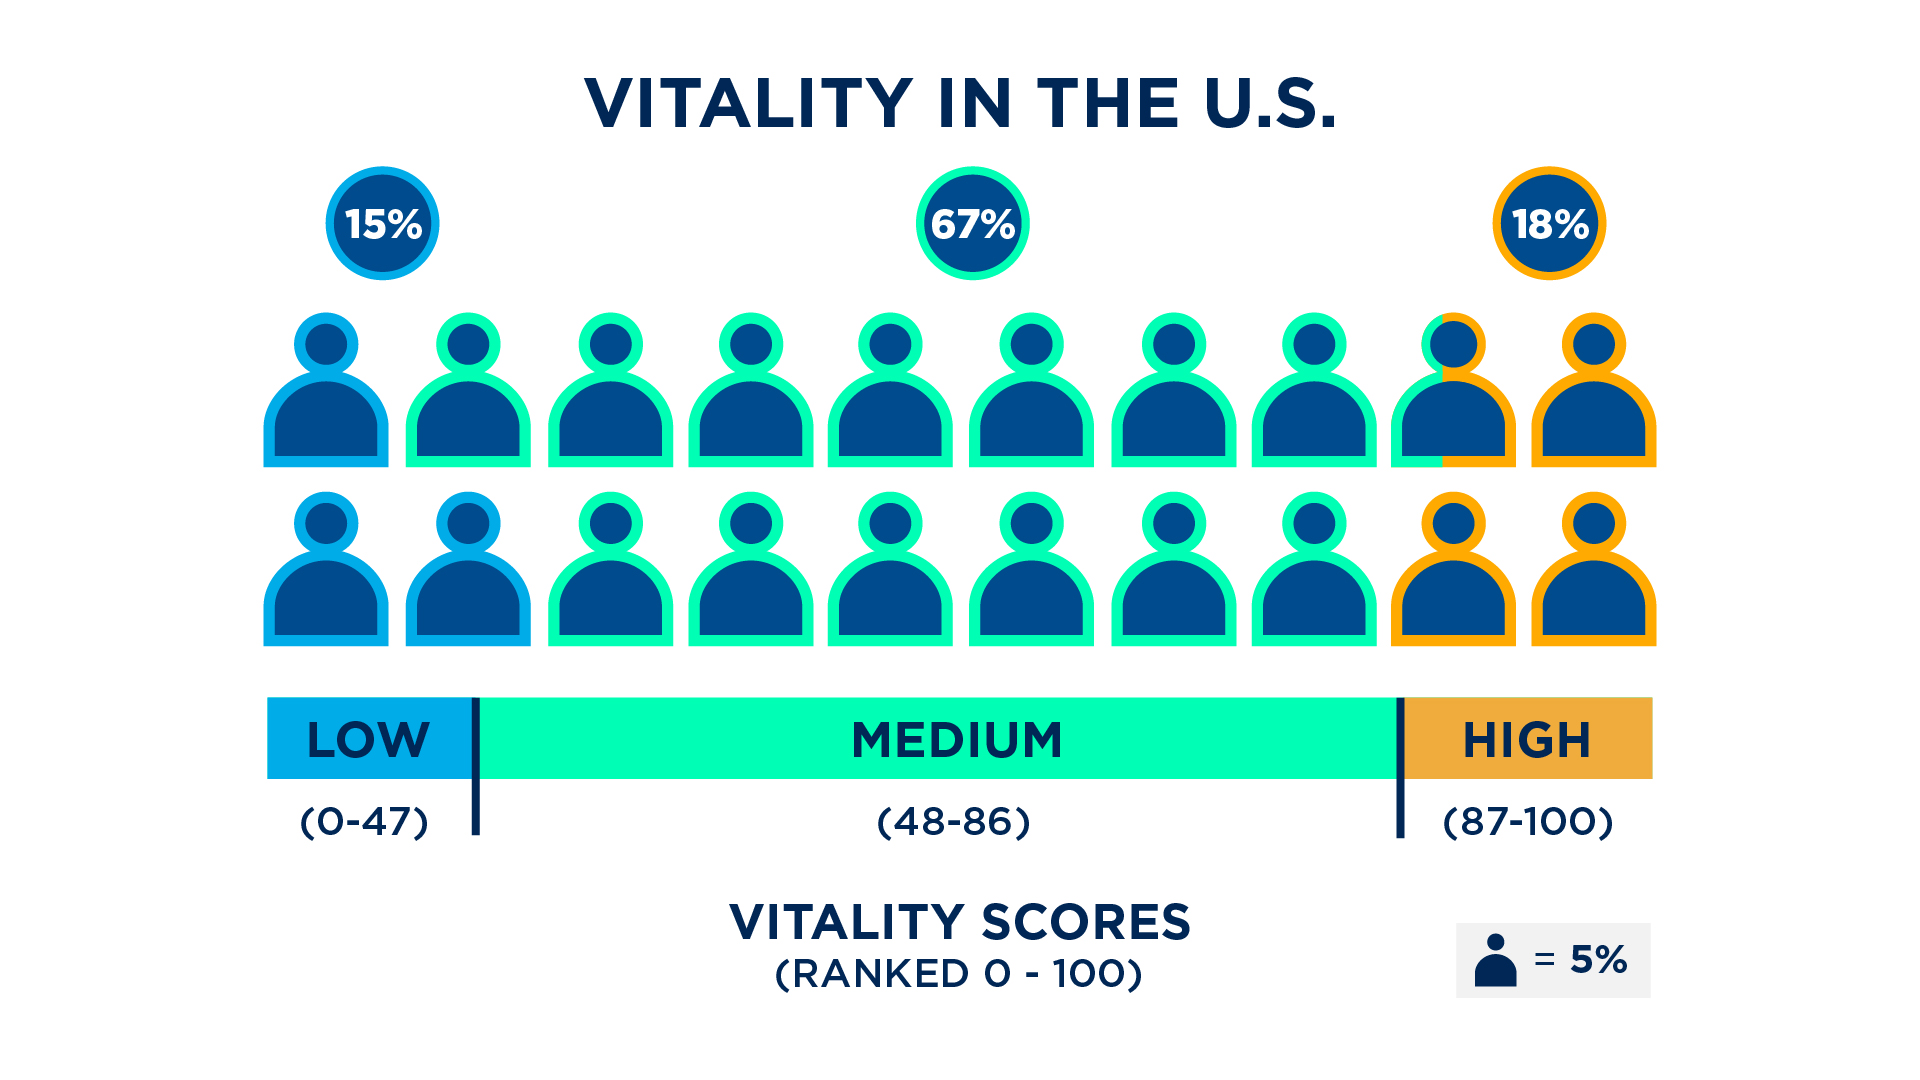
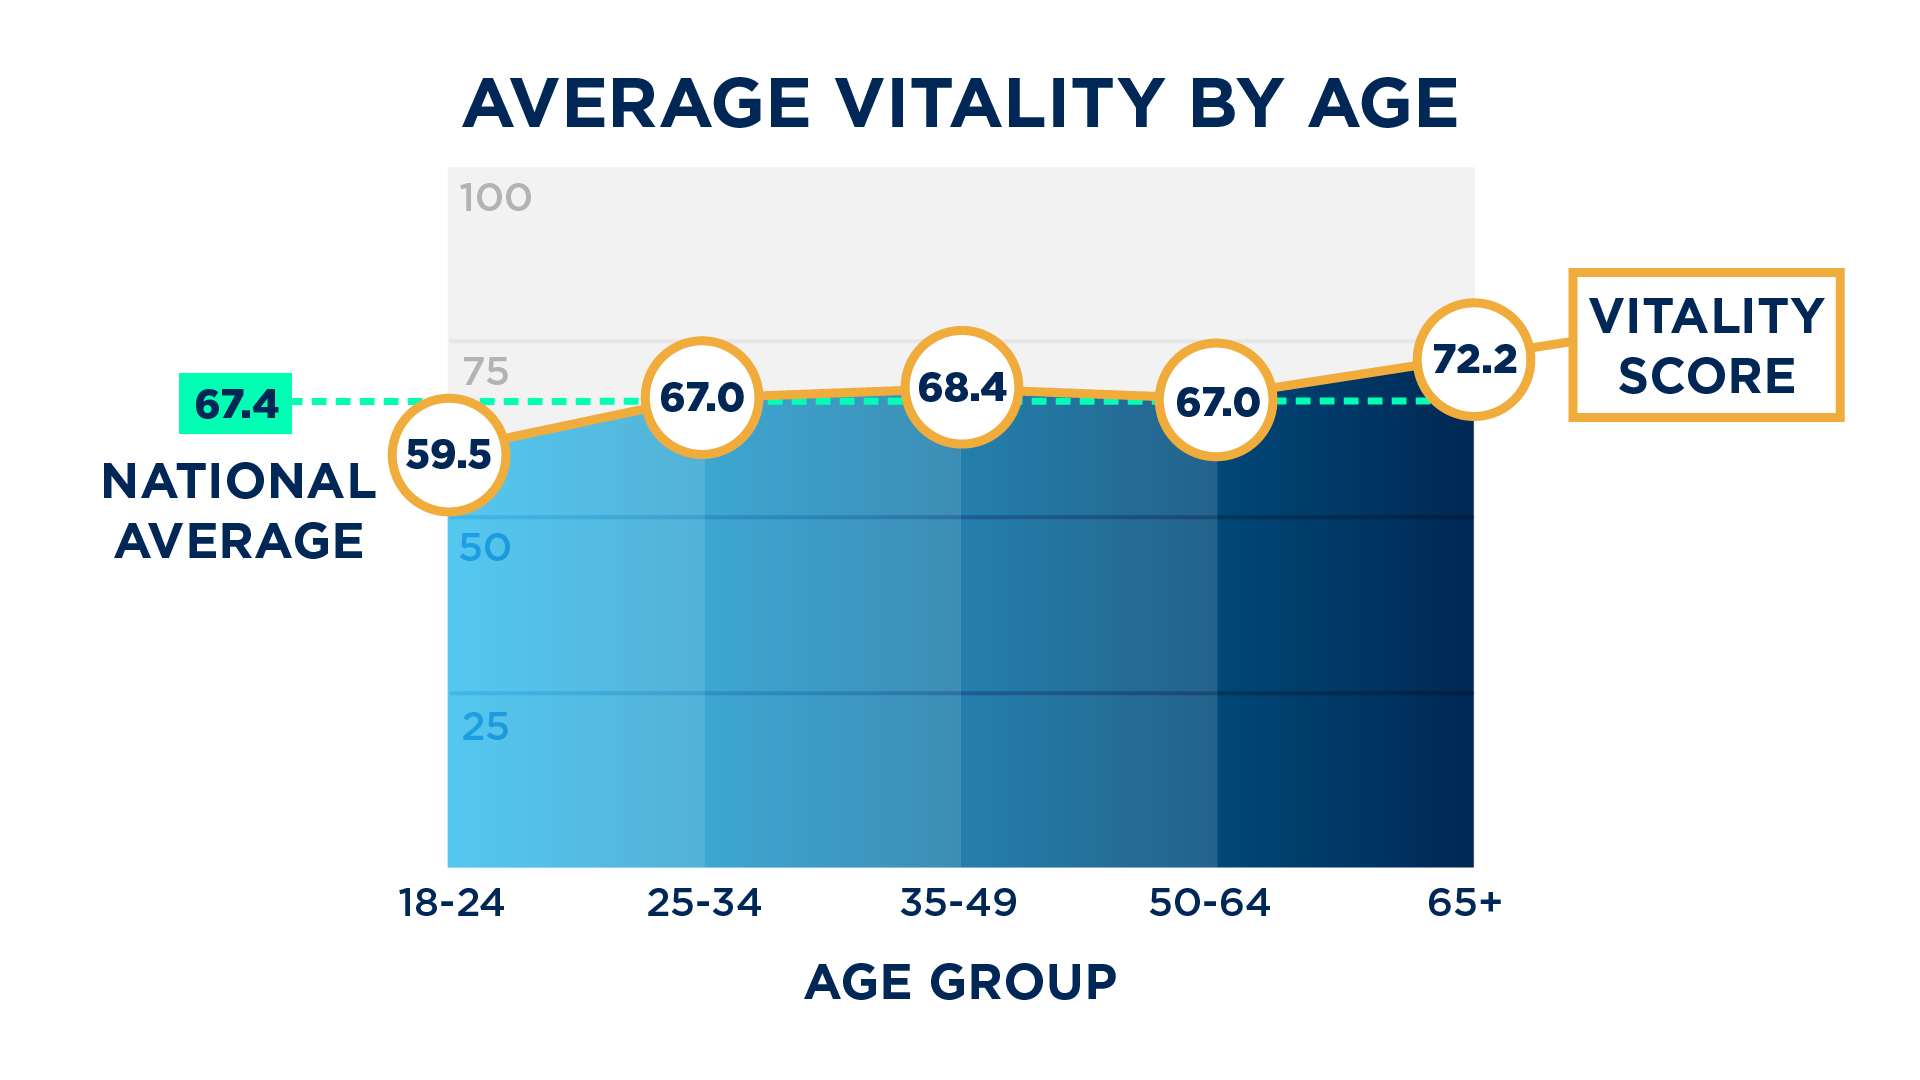
But our research also revealed that most Americans are not experiencing high vitality. In fact, less than one in five U.S. adults have high levels of vitality, which jeopardizes their ability to engage and contribute, impacting families, communities, work, and more. A combined 82% fall in the low and medium vitality categories, including 15% who are experiencing low vitality. The average vitality score among the general population is 67.4 out of 100.
Life stage, gender, community density, sexuality, and income are some of the factors by which vitality varies. Just as unequal challenges and circumstances result in well-documented health disparities, there are notable disparities in vitality.
Seeing disparities reflected in vitality is confirmation of its ability to capture and reflect whole-person health in all people. While we have contributed to addressing health equity, the Evernorth Vitality Index shows there is much more work required. We are committed to improving the vitality of the lives we touch, and we will use this data to help identify priority areas of action.
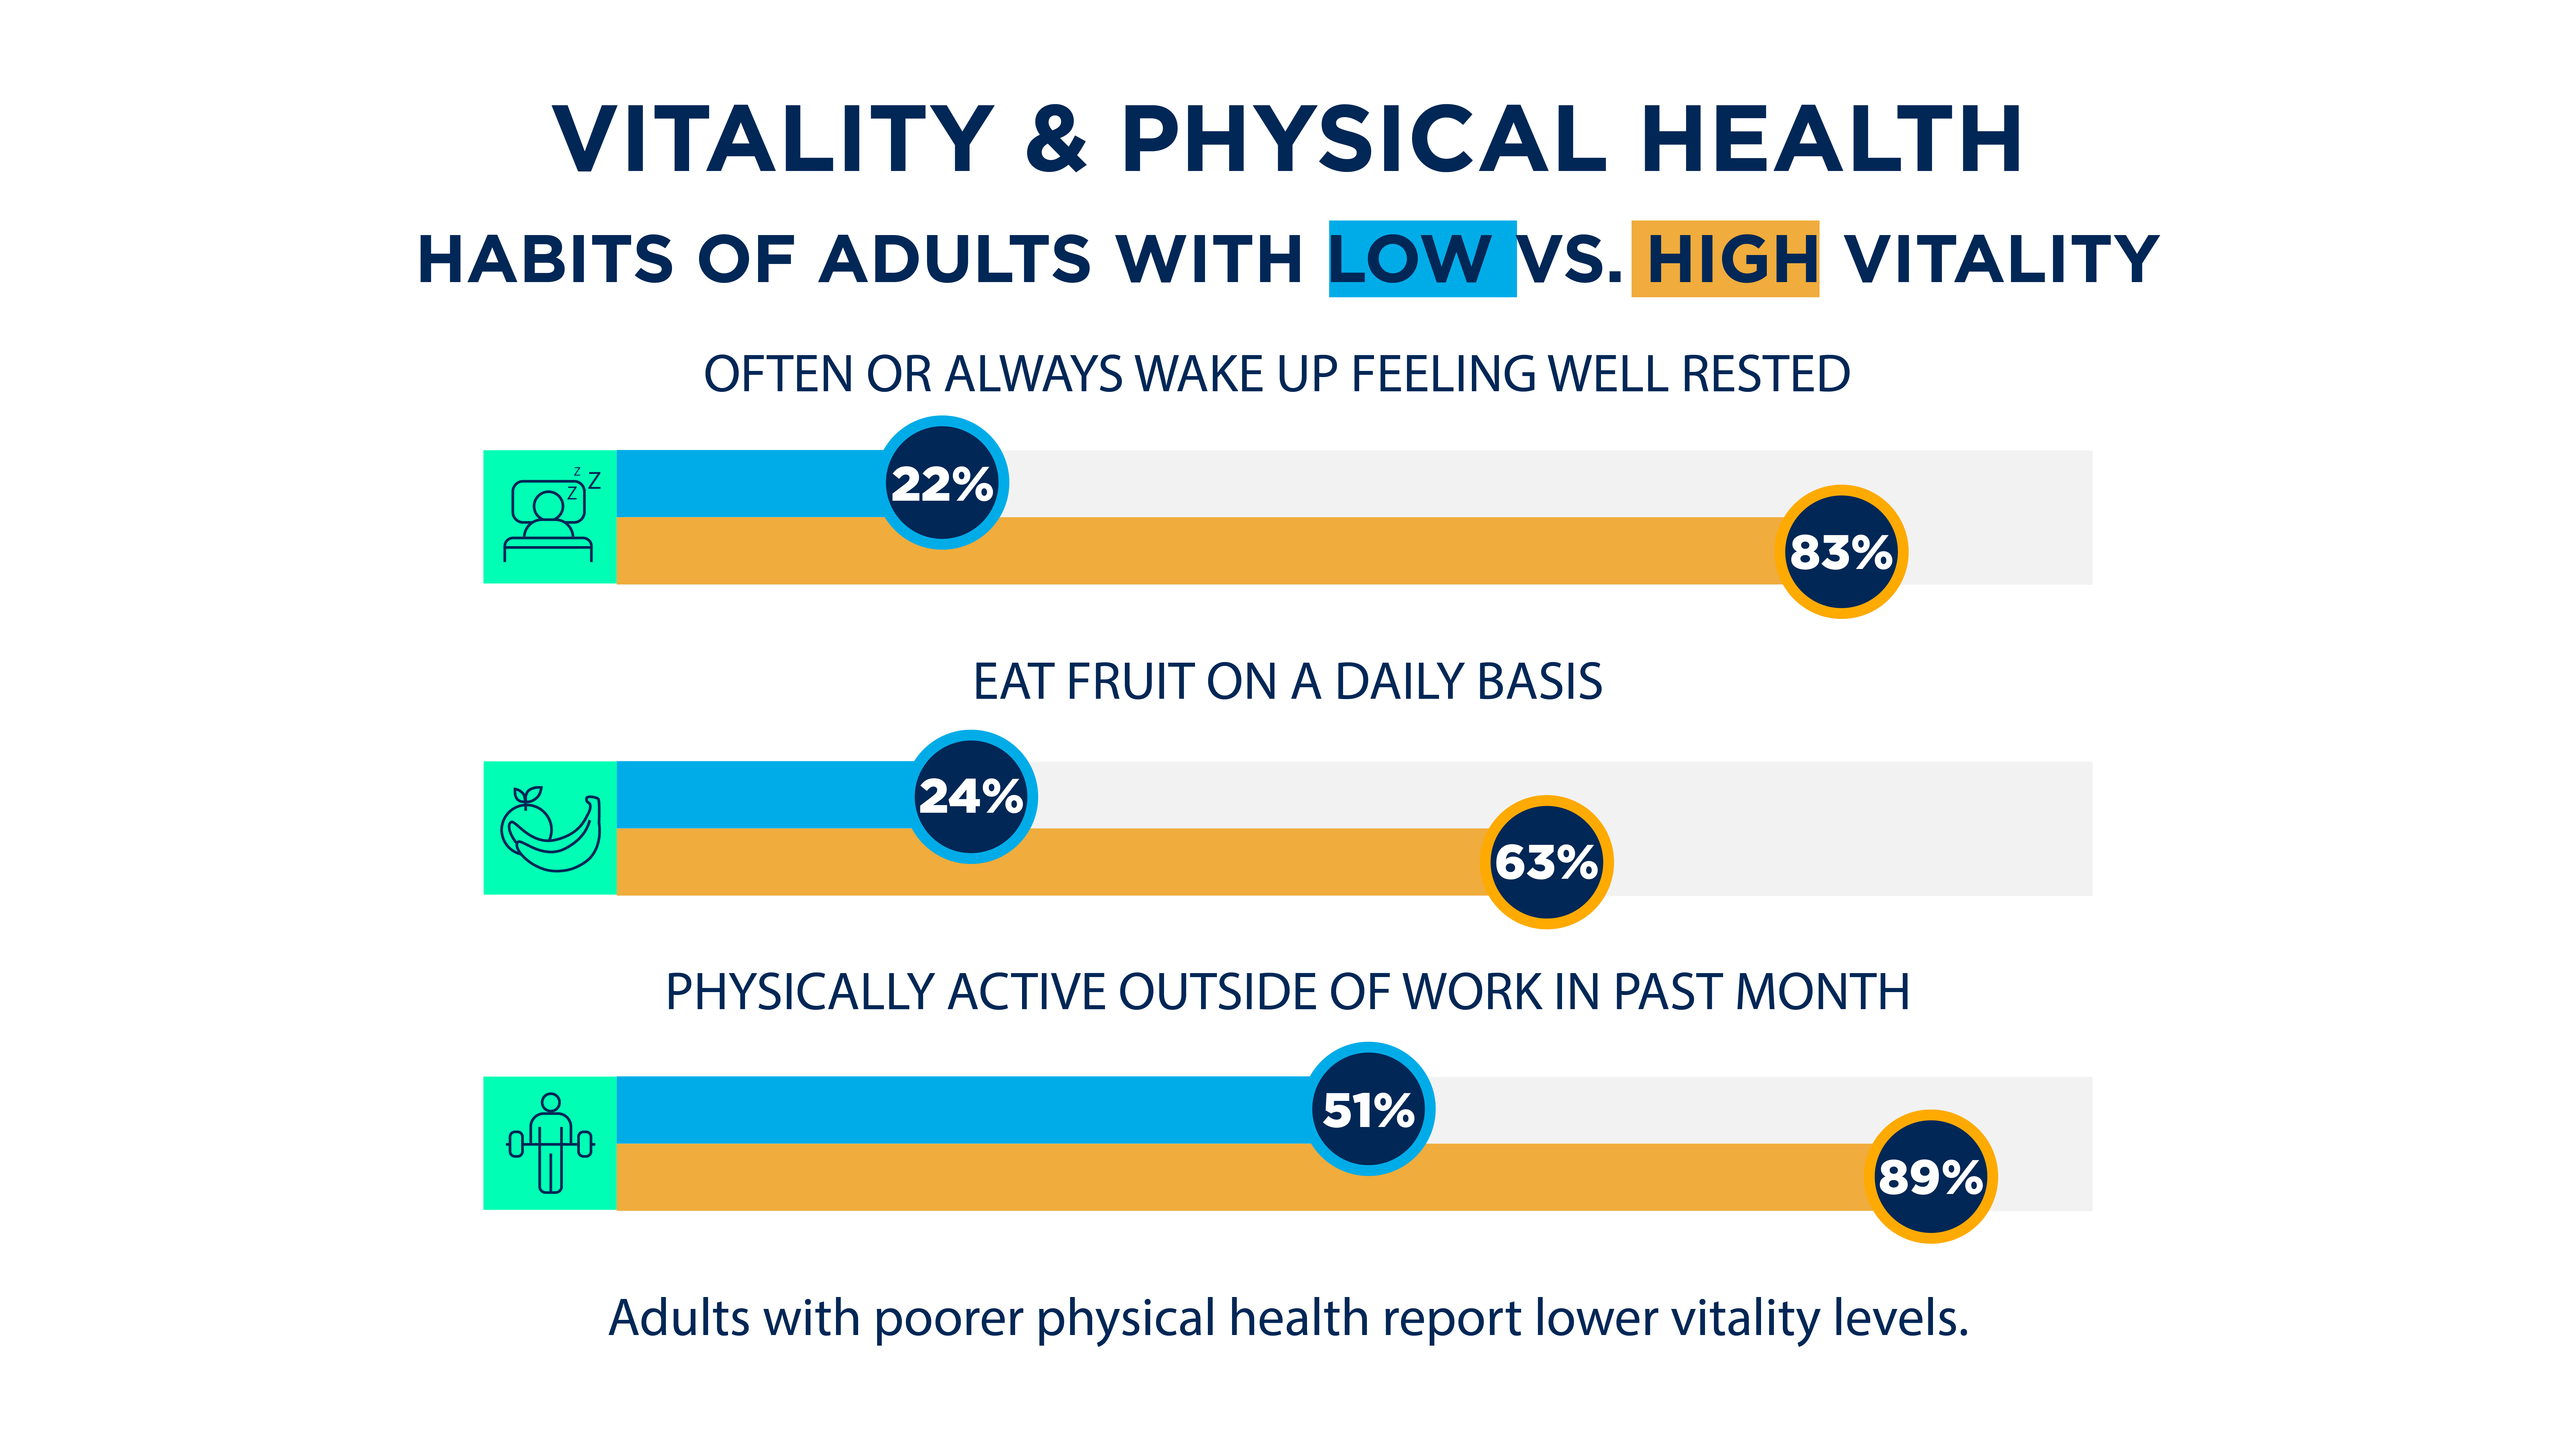
More than two in five people (43%) with low vitality say their overall health is fair or poor. They are more likely to experience chronic physical and mental health conditions, such as obesity, depression, and anxiety. They are also less likely to get quality sleep or wake up feeling well-rested, and are less likely to get the exercise or care they need. The opposite is true for people with higher vitality.
Vitality and Life Stage
People aged 18-24 represent adults who are part of Generation Z, and one in four are living with low vitality that is negatively impacting their health and well-being. This is in stark contrast to the 10% of people aged 65-75 and the 15% of people aged 25-64 who fall into the low-vitality category.
Low vitality among Gen Z adults demonstrates the value of looking beyond physical health, as a simple review across generations would find that they are, unsurprisingly, in good physical health relative to other age groups. They have lower rates of chronic conditions and are less likely to be obese, but that contradicts their overall lack of wellness that is likely to have physical consequences in the future if left unresolved.
The research revealed Gen Z adults with low vitality are:
- Less physically active: A full third (33%) have not engaged in any physical exercise outside of their job in the past month, compared to 26% of adults overall.
- Less likely to have healthy diets: Less than one-third (29%) consume fruit on a daily basis, compared to 41% of adults overall.
- Less likely to get quality sleep: Gen Z adults are 10 points less likely to get 6-10 hours of sleep a night (69% do) than the overall population (79%).
Gen Z adults with low vitality levels uniquely face a crisis of competence, lacking confidence in their ability to manage their lives in general and across dimensions of health. This deficit appears to be particularly damaging to the mental health of Gen Z, as nearly one in three (32%) have been diagnosed with or are receiving treatment for clinical depression or anxiety – far higher than the general population rate of 21%. They are also more likely than people in other age groups experiencing low vitality to report symptoms of mental health issues.
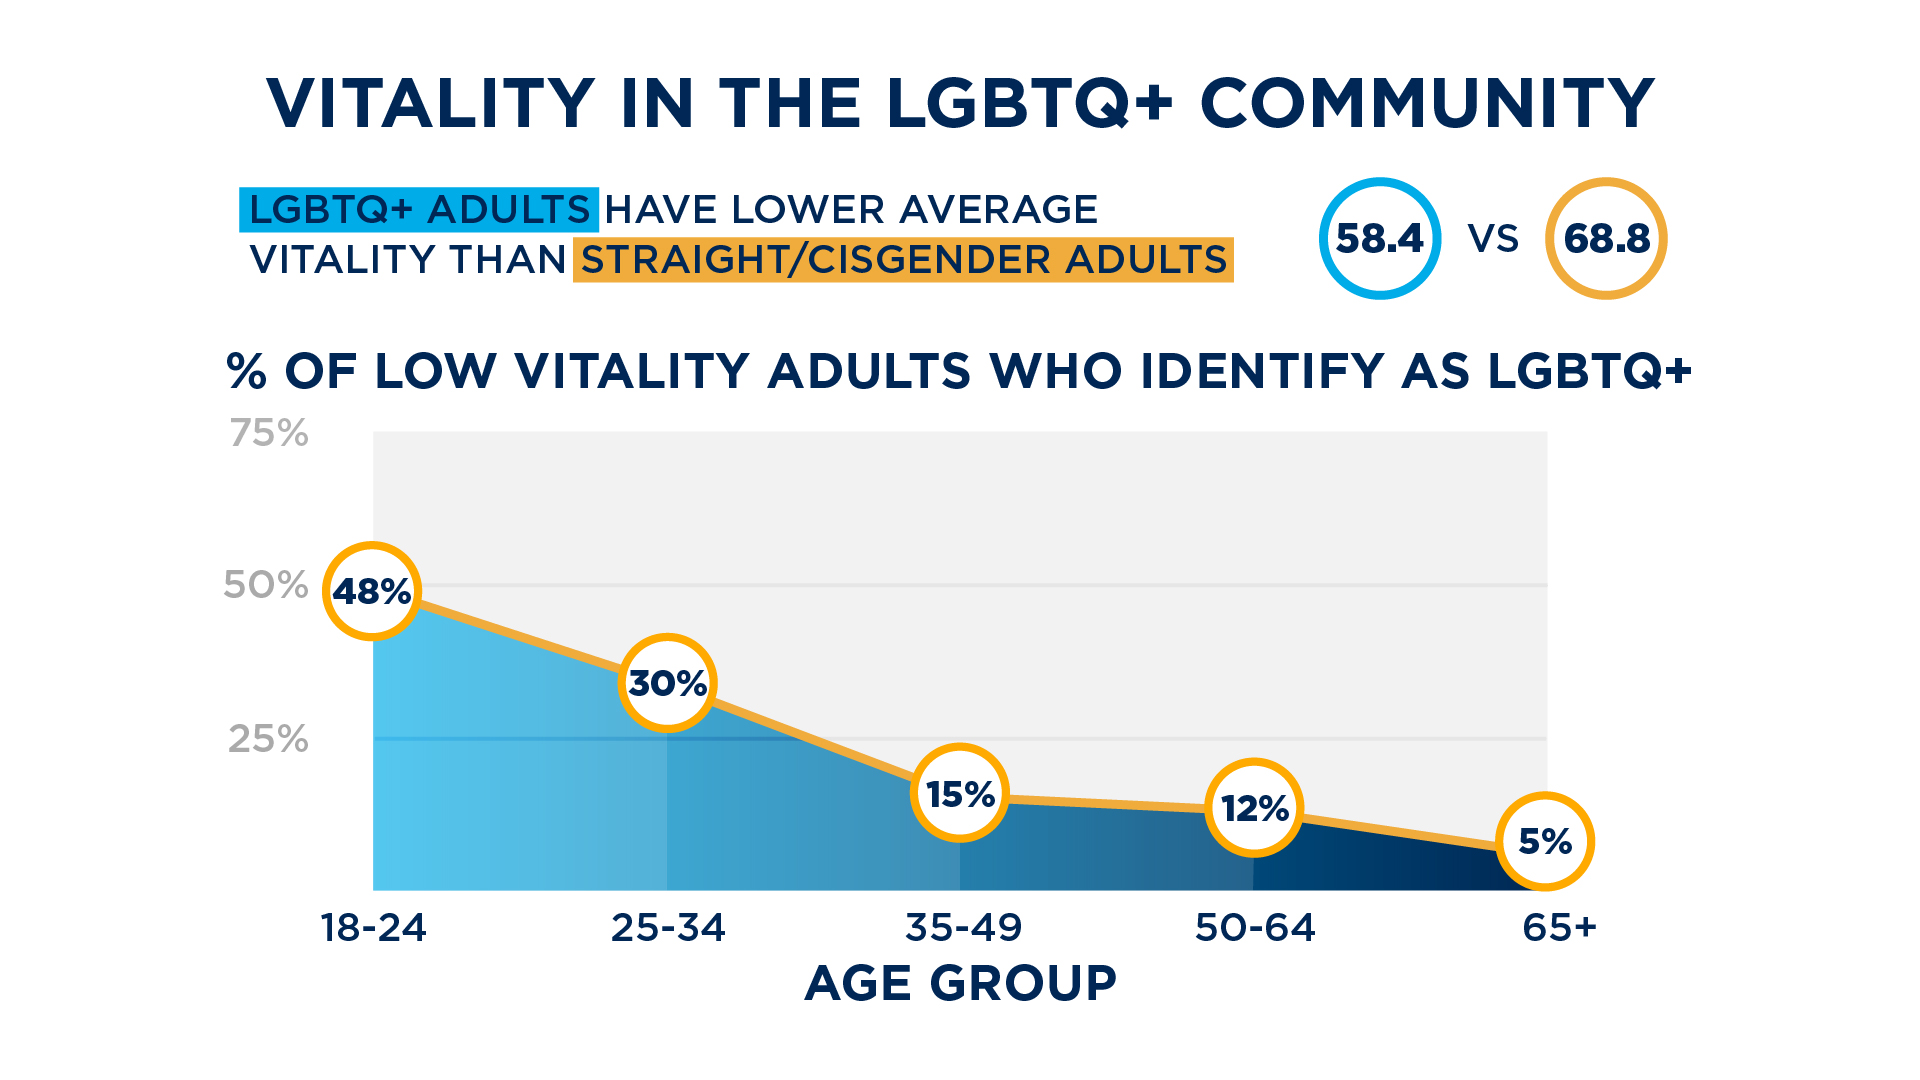
Gender, Gender Identity, and Sexual Orientation Impact Vitality
Further, nearly half of Gen Z adults with low vitality identify as LGBTQ+, and LGBTQ+ adults have dramatically lower vitality levels than heterosexual, cisgender adults.
In digging deeper, the research found that LGBTQ+ adults tend to have weaker social ties and are far less likely to be engaged with work that they find interesting and suited to their abilities. Additionally, the LGBTQ+ community faces barriers in finding health care providers who are culturally trained and sensitive to their health needs. For example, 50% of LGBTQ+ individuals strongly feel their provider really listens to them, compared to 63% of heterosexual, cisgender individuals. Also, 49% of LGBTQ+ individuals strongly feel respected by their provider, compared to 62% of heterosexual, cisgender people. The trend continues with 51% of LGBTQ+ individuals reporting strong feelings of trust in their provider, compared to 65% of heterosexual, cisgender people.
The study reveals that women are also struggling disproportionately with their vitality and overall well-being. Women are 50% more likely to have low vitality levels than men (18% vs. 12%).
There are a number of potential explanations for lower vitality levels in women. For example, women are less likely than men to report that their overall health is excellent or very good (43% vs. 57%). They are far more likely to suffer from clinical depression or anxiety (29% vs. 13%). Women with chronic conditions feel less strongly equipped to treat their condition (42% vs. 54%) and are less likely to have support around them to help (44% vs. 53%). Finally, women are less likely to feel a sense of belonging in their community (43% vs. 53%), which contributes to them being more likely than men to experience loneliness (56% vs. 49%).
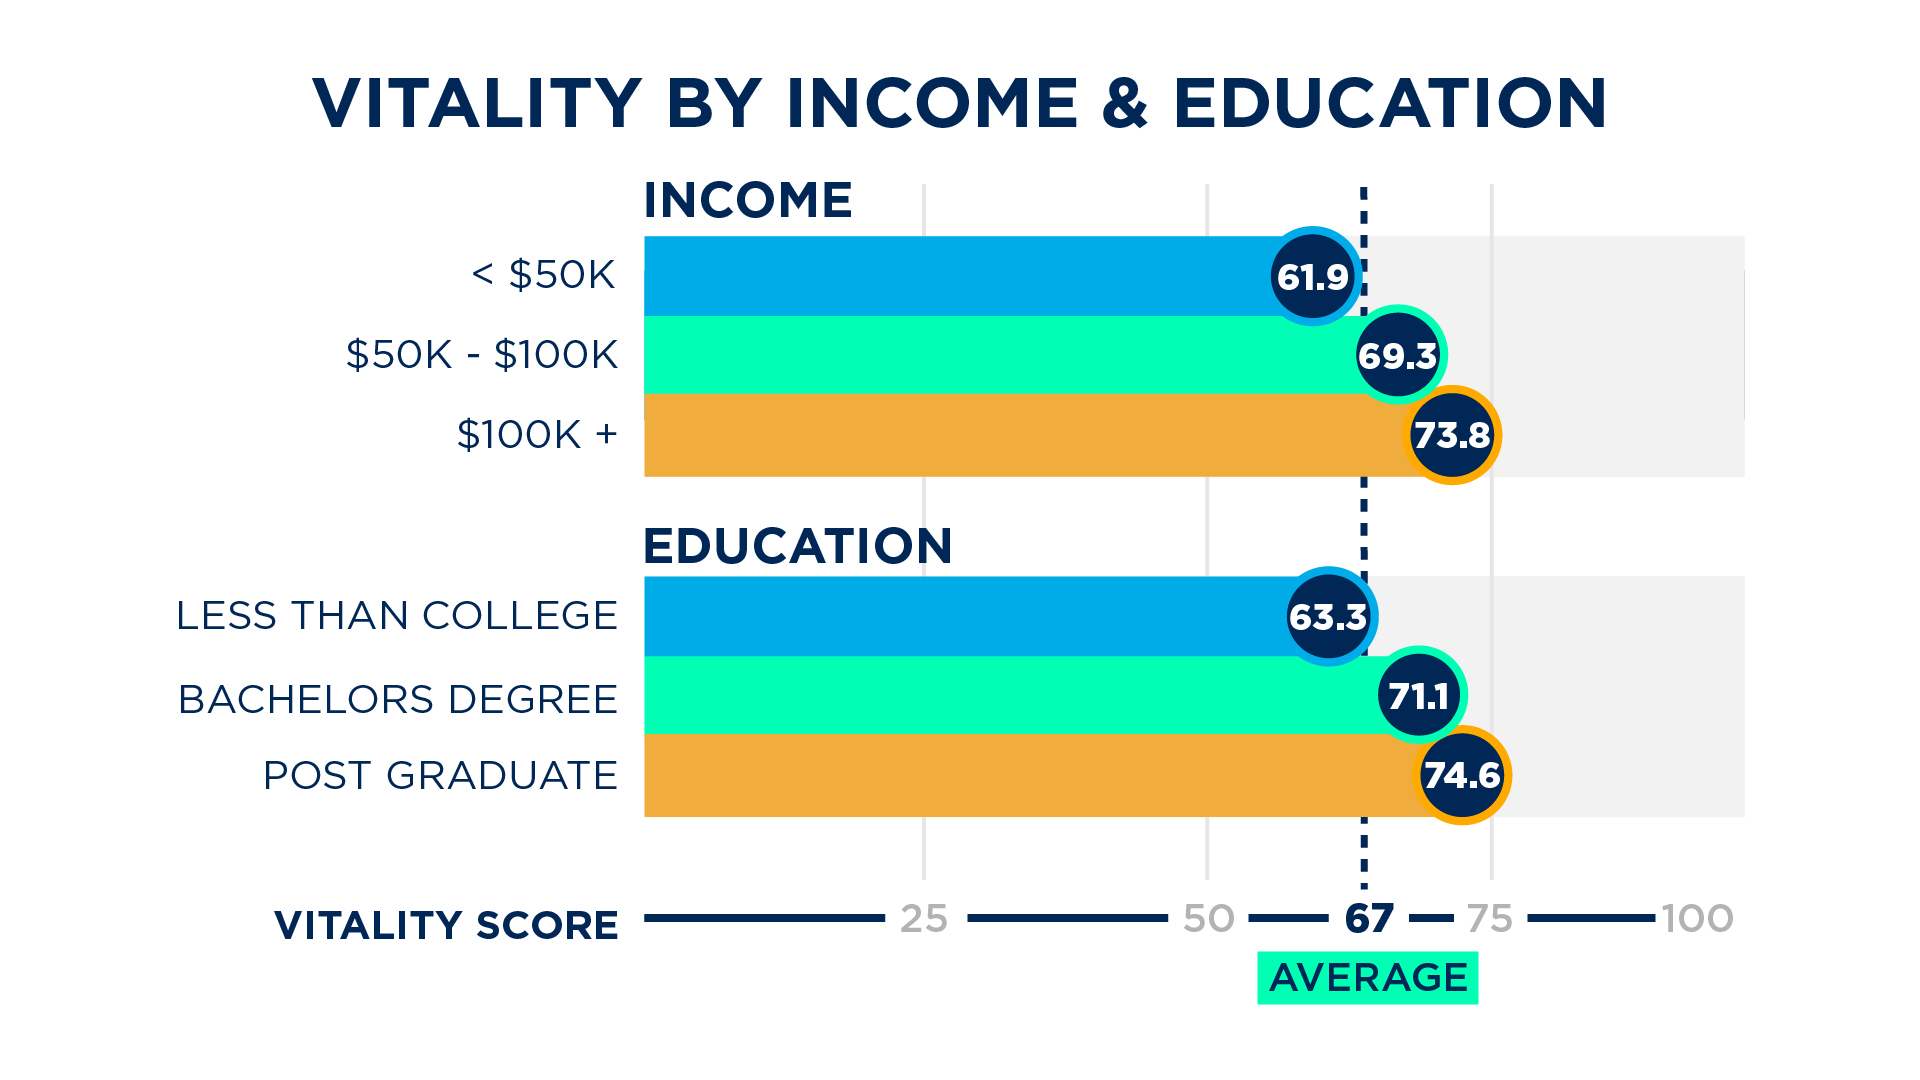
Vitality and Socioeconomic Divides
Vitality is also impacted by socioeconomic factors like income and education levels. Individuals with lower incomes and education report significant obstacles to vitality and well-being across dimensions. These negative effects are compounded when people feel a lack of ability to make changes and be in control of their lives because of those factors. People in lower-income households are in significantly worse health, with 37% reporting very good or excellent overall health compared to 66% from higher-income households.
Individuals from lower-income households are more likely to experience loneliness (63% vs. 44%) and more likely to struggle to cover their living costs (46% vs. 18%). Along with reporting higher levels of economic uncertainty, they also report lower skills and knowledge of how to manage their finances (47% vs. 66%).
There are also financial gaps in access to health care. Nearly one-quarter (24%) of people in lower-income households have gone without care due to a lack of transportation, compared to 19% in higher-income households, and nearly one-quarter (23%) report skipping a doctor’s appointment due to a lack of funds, compared to 18% in higher-income households.
Vitality's Impact on the Body and Mind
Adults who rate their physical health as excellent or very good have an average vitality score 22 points higher than those who rate their health as fair or poor. Regardless of their current health, people with higher vitality are more likely to report having healthy habits. They also are less likely to experience chronic pain and when they do, they are better able to manage it.
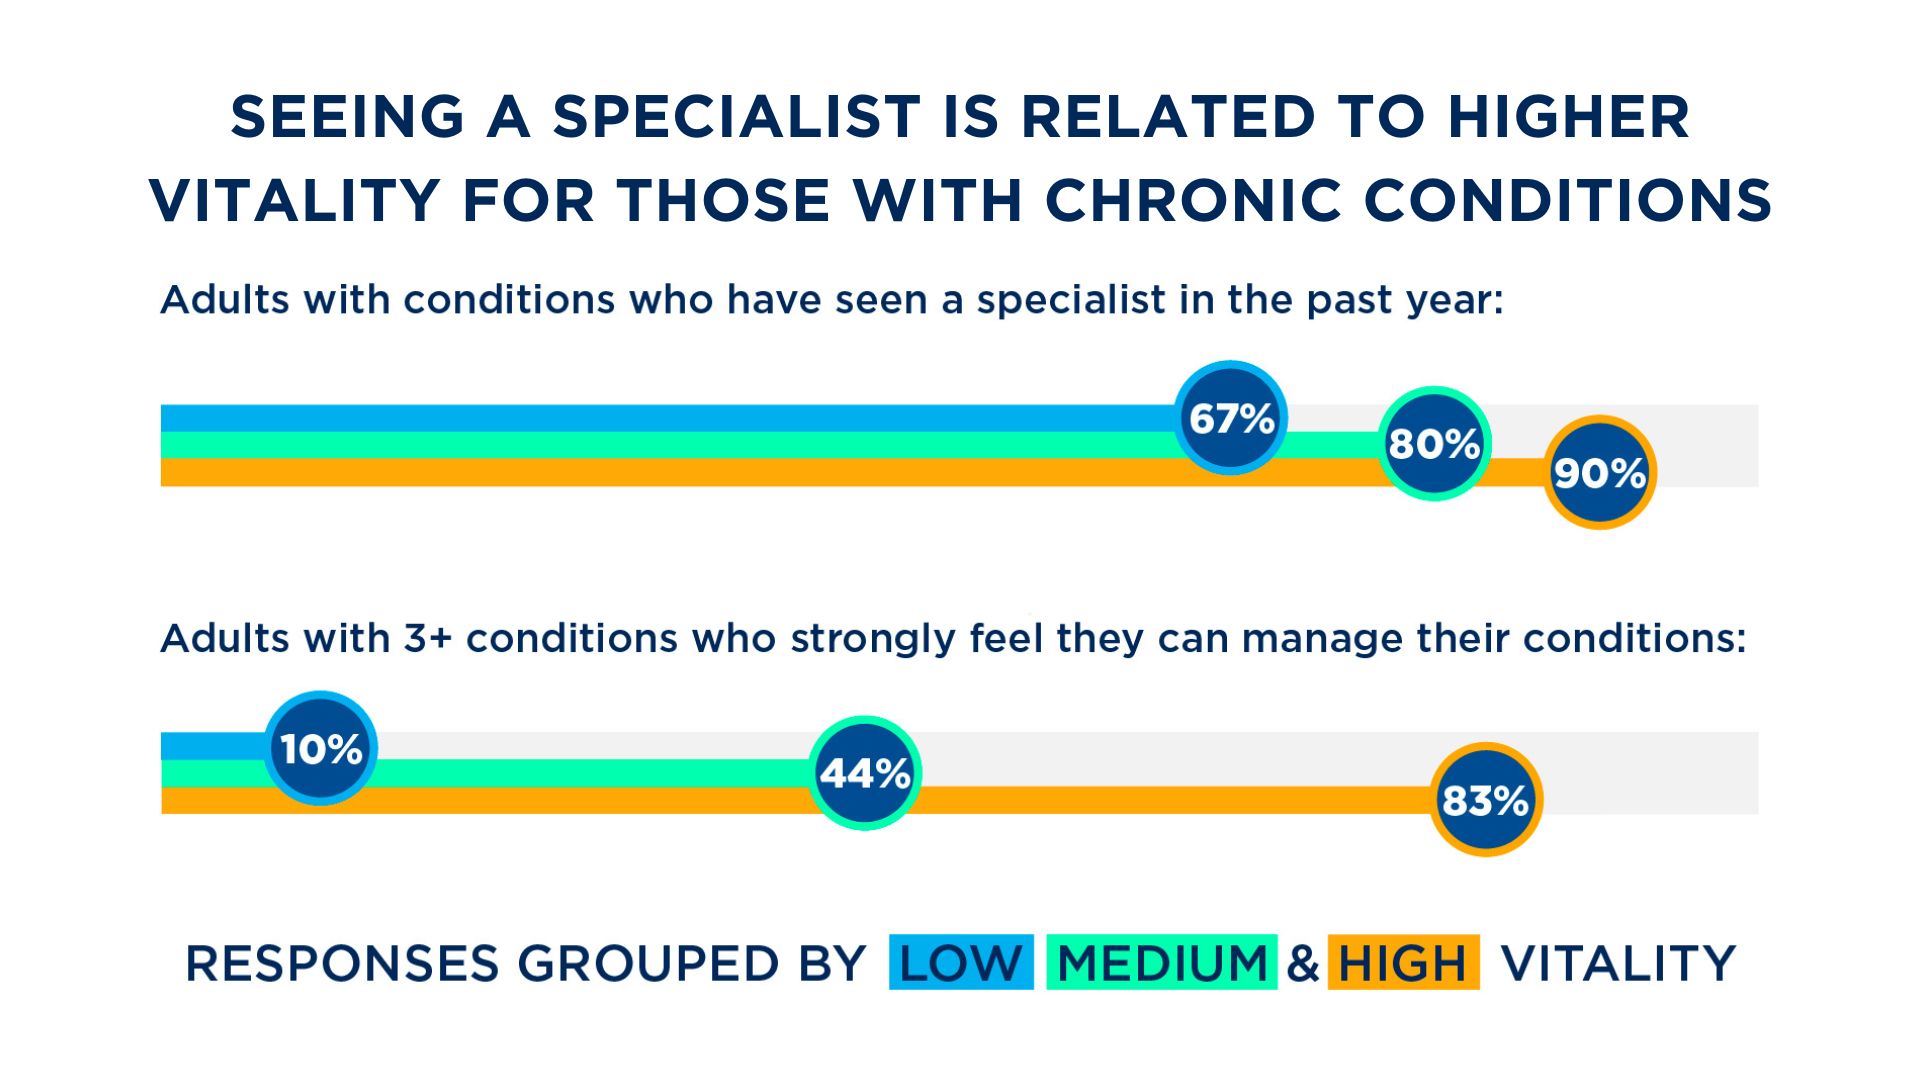
Individuals with chronic conditions tend to have lower vitality compared to those without chronic conditions, and the trend becomes more significant as the number of conditions increases. Some people demonstrate high vitality while living with chronic health conditions, which appears to be linked to their ability to better manage those conditions. In fact, 63% of high-vitality individuals with two chronic conditions strongly agree they are able to manage them compared to 6% of their low-vitality counterparts. High-vitality adults with three or more chronic conditions overwhelmingly (83%) report strong confidence in managing their conditions – more than eight times the rate of low-vitality adults diagnosed with three or more chronic conditions (10%). They are also more likely to have seen a specialist in the past year (92% vs. 81%). Through the lens of vitality, we see motivation to rise to the challenge of managing multiple chronic conditions comes from increasing individuals’ autonomy and competence and leveraging their strengths across the dimensions of health.
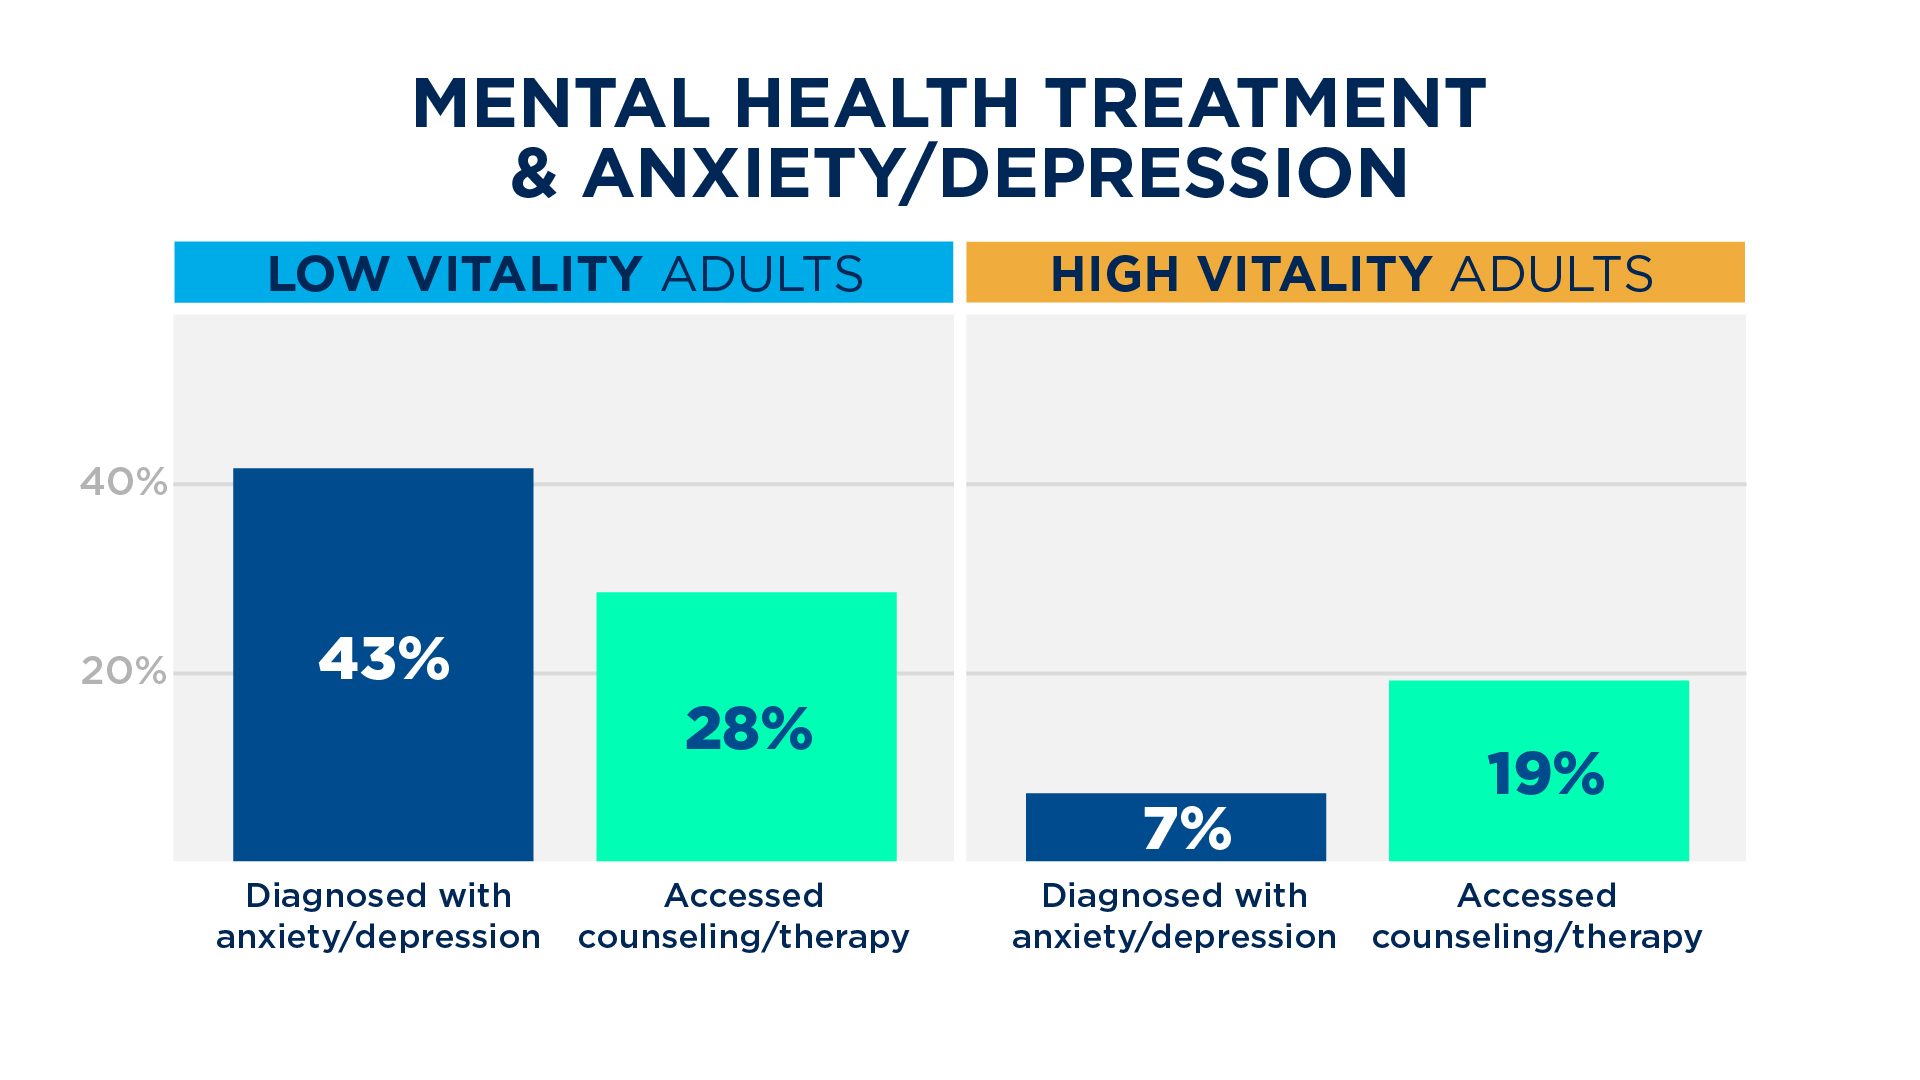
Our research also found that vitality levels are strongly linked to the prevalence of clinical depression or anxiety. Adults who report their mental health as excellent or very good have vitality levels that average 25 points higher than those who say their mental health is fair or poor. Proactive use of mental health care – such as counseling or seeing a therapist – is associated with higher vitality levels.
The Bright Spots: Living With Vitality Despite Challenges
Our research identified several cases where individuals we expected to have lower vitality levels, demonstrate higher levels – illustrating that the capacity to pursue life with health, strength and energy is multi-dimensional and personal.
Although our research was not intended to capture unique habits for individuals thriving despite the challenges, it confirmed that healthy behaviors such as good sleep, healthy diet and exercise are correlated with higher vitality.
In looking at high-vitality adults with annual household incomes under $50,000 and comparing them with high-vitality adults with incomes over $100,000, we found that the lower-income group shows higher levels of autonomy and are more likely to actively choose to prioritize their health. Their attitude and physical health offer alternate pathways to overall wellness despite constraints in the financial domain.
The high-vitality, lower-income group generally feels a sense of financial autonomy, but not to the extent of higher-income, high-vitality adults. Lower-income, high-vitality adults face greater financial constraints and are less likely than higher-income, high-vitality adults to report a strong sense of freedoms and opportunities to financially support themselves (85% vs. 95%), and those in the lower-income group are still more likely than adults with high vitality and higher incomes to report not being able to meet their cost of living in the last year (31% compared to 20%).
On the other hand, lower-income, high-vitality adults have a more intense sense of choice and freedom than high-vitality, higher-income individuals (52% vs. 44%), and they prioritize their physical health at a higher rate (61% vs. 53%). High-vitality, lower-income individuals are also more confident that their health won’t worsen (44% vs. 27%).
People in this group tend to have stronger social ties, are more likely to experience a warm feeling with the people they spend time with (63% vs. 52%), and feel glad to be with the people they spend time with (75% vs. 59%). They are also less likely to say their personal life suffers because of work (21% vs. 34%).
Living outside an urban or suburban area can limit access to food, care, and other drivers of health. While respondents living in rural areas report worse health and well-being, some are able to achieve high vitality.
High-vitality rural residents do face some of the challenges endemic to the rural demographic. Seventy-two percent of high-vitality rural adults report their physical health as excellent or very good. In comparison, 88% of those living with high vitality in urban areas report excellent or very good physical health, as well as stronger mental well-being.
However, stronger social connectivity plays a role in counterbalancing those challenges for high-vitality rural adults: 71% of high-vitality rural residents say they are very glad to be with the people they spend time with, compared to 60% of high-vitality urban adults. Sixty-seven percent of high-vitality rural residents very strongly feel they have the social skills needed to make friends, compared to 58% of high-vitality urban residents. In addition, just 22% of high-vitality rural residents are experiencing feelings of loneliness, compared to 38% of high-vitality urban residents.
Rural residents with higher vitality also tend to have less stressful work, better manager relationships, and wider access to employee benefits. Only 16% find it difficult to express opinions about job conditions to superiors, compared to 33% of high-vitality urban residents.
As a result, high-vitality rural residents are less likely than their urban counterparts to feel drained (13% vs. 31%), to feel “lifeless and unenthused” (12% vs. 30%), and to report having lost their “get up and go” (12% vs. 35%).